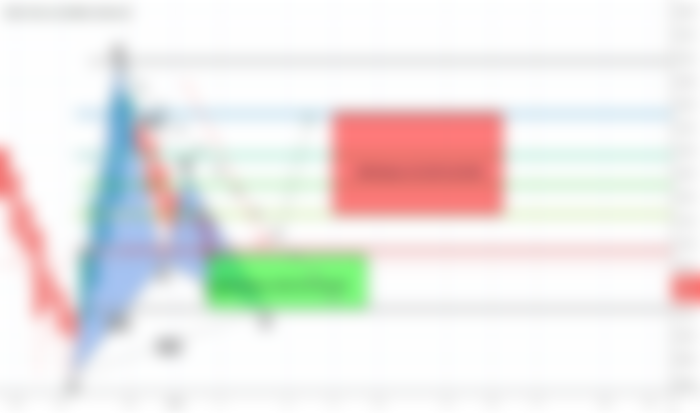
A powerful big move upto 285%:
On 3rd January 2020 I posted an article where I have revealed that the price action of DASH had completed the formation of bullish Gartley pattern. The pattern was begin on 27th of December 2019 and completed on 2nd of January 2020. When I published the chart the priceline was just entered in the potential reversal zone after the completion of this pattern.
And the DASH had the value of $40. 15. The potential reversal zone or buying zone of this pattern was from 40. 72 dollars and the maximum extent of this zone was $39.58. From this level the price action was expected to move up to atleast enter in the Fibonacci projection area of A to D leg from 0.382 to0.786 Fib level.
This pattern was very short term 12 hour time period and on very next day the priceline of DASH coin moved up with the powerful divergence and produced really very massive profit up to 285%.
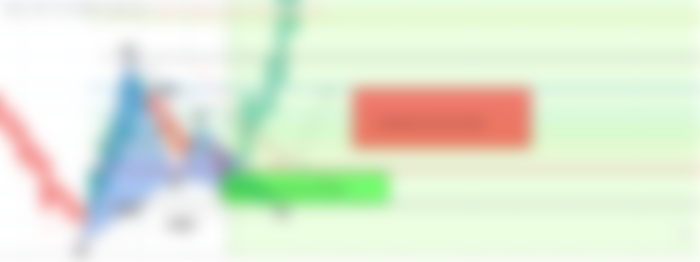
Before execution:

After execution:

Falling wedge:
On weekly chart it can be observed that since December 2018 price action of Dash coin is moving in a falling wedge. And during this recent strong bearish trend the priceline has hit the support of this wedge for another time. After placing the volume profile on the complete priceline moving within this falling swedge we can see that the traders interest is very low below the support of this wedge and point of control of this wedge is at $71.
Even though the Bollinger band has been expended and there is some more space in the Bollinger band that the price action can move more down to hit the lower bands or support of the bollinger bands but as we have just discussed earlier that the traders interest is very low below the support level of this wedge pattern therefore it will be really difficult for the price action of DASH coin to move down, up to the support of bollinger bands. And as we have the point of control at $71 therefore the price action is moved up to this point of control.

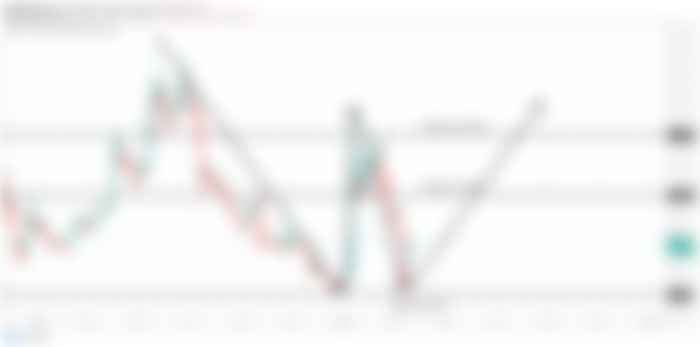
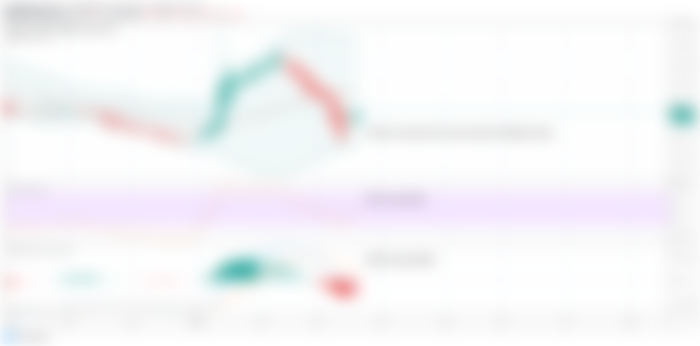
The support and resistance levels:
After the recent drop from January to this month it can be clearly seen that the price action of DASH coin has hit at the support of $38.16 and after hitting at this support it is turned bullish and moved up by 126% this Bounce from the support level is forming a double bottom pattern as we can see that the price action had first drop from May 2019 up to December 2019 and the recent downwards move from January 2020 to March 2020.
Now the next resistance level for the price action if would be $100 and this resistance can be big hurdle for the priceline to have break out from this level because since December 2018 this level has been working as resistance and sometimes at support as well.

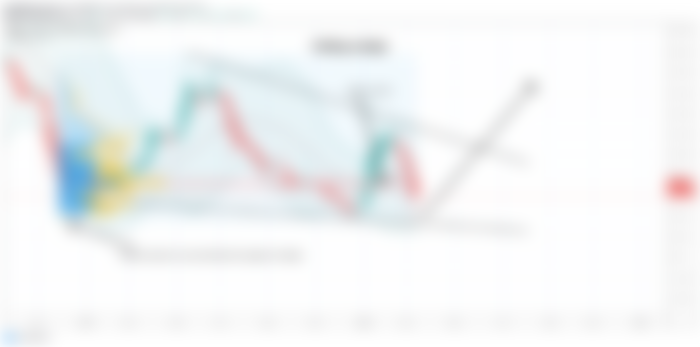
Bullish harmonic BAT pattern:
Now if we see on 4 days chart then a very clear bullish harmonic BAT pattern has been completely formed. The initial leg was started from the candlestick of 27th December 2019 and it was completed on 30th January 2020. then the price action retraced between the area 0.382 to 0.50 Fibonacci level. And this was the first confirmation of bullish BAT pattern then the price action is moved up and projected between 0.382 to 0.886 Fibonacci projection level and this is the projection of A to B leg this was the second confirmation of bullish BAT pattern. And the recent drop of February 2020 has helped the DASH coin to complete the last bearish leg of bullish BAT pattern and finally the C to D leg has been retraced between 0.786 to 0.886 Fibonacci level. Even though the price action has hit the spike beyond the potential reversal zone but in every next it was the retraced back in the PRZ level and this PRZ level starts from $63.13 up to $51.45. Now from this potential reversal zone level it can be expected that as per BAT pattern and its Fibonacci sequence the price line should move up in the projection area of A to D leg from 0.382 to 0.786 Fib level and this Fibonacci projection area starts from $91 and ends up to $132.92. So it can be upto 158% big bullish move. but if the price action will manage to cross up the 0.786 Fibonacci projection level then after that the price line of dash coin can turn more bullish.
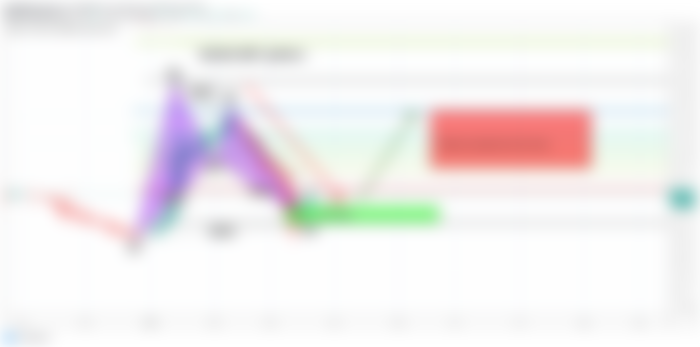

On the same 4 day chart if we see indicators in oscillators then it can be clearly seen that the price action is getting bounced from the lower band of the bollinger bands and the Relative strength index (RSI) went very close to the oversold zone and now it has turned bullish the moving average convergence divergence (MACD) was strong bearish but now it has also turned weak bearish so almost all the indicators and oscillators are turning bullish.

Conclusion:
As per above studies of the chart we can conclude that now the DASH coin can hit the price between $91 up to $132.92 and we can use the maximum extent of buying zone or PRZ level that is at $51. 45 as stop loss.