Strong bullish rally and retracement at golden ratio:
The Chinese Yuan has been moving up with a strong bullish rally since June 2007 to January 2014 that is almost seven years that the Yuan has been moving up against the US dollars. Then from January 2014 to January 2017 the Chinese Yuan moved down and retraced at 0.618 Fibonacci level that is the golden ratio therefore there were strong chances that it will again move up from this golden ratio and as per expectations the Chinese Yuan moved up again and took another powerful bullish divergence from January 2017 to March 2018 and this move was upto 11.48% for more than a year.
Then from March 2018 the Chinese Yuan again started moving down against the US Dollar and at this time it is again at the same golden ratio of 0.618 Fibonacci level
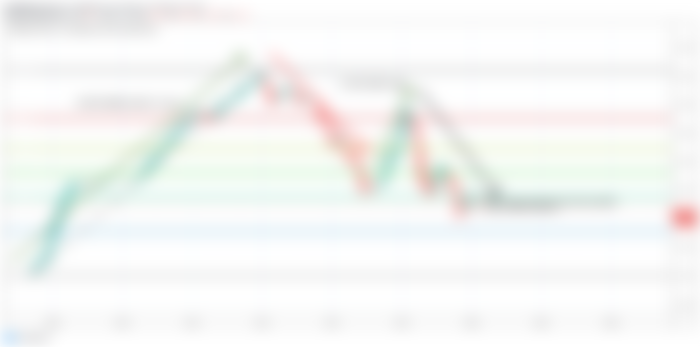

.
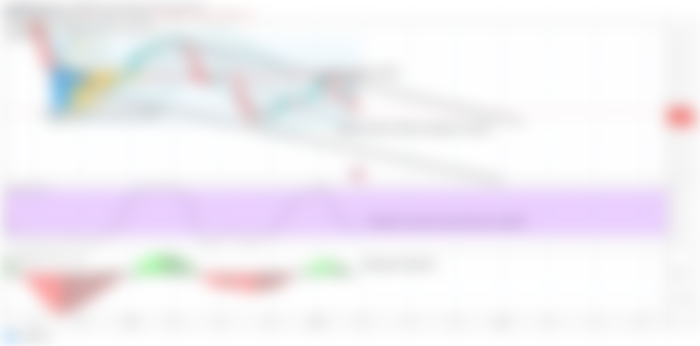
Down channel and volume profile and other indicators:
If we switch to the weekly chart then it can be clearly observed that from August 2018 the priceline of Chinese Yuan is now moving in a down channel. After August 2018 the price line has hit at the support of the channel on September 2019. Even though this time after hitting the resistance of the down channel the price action of Yuan is moving down but we can expect that this time the priceline will not reach the support of the channel. If we examine the price action of Yuan then in August 2018 we had the bollinger bands at the support of the channel. And when in Sep 2019 the price action was hitting for the second time on the support the channel at that time the bollinger bands was again at the support of the channel. But this time the Bollinger bands is above the support of this channel and there is a big distance between the support and the lower bands of the bollinger bands. Therefor this time the bollinger bands can play the role of biggest hurdle to stop the price action to move down up to the support of the channel.
Here I have also placed the volume profile on the complete price action moving within this channel and after placing the volume profile it can be clearly seen that the trader’s interest is very low below the $0.14. That is almost the same level where we have the lower bands of the Bollinger bands. And the point of control of the volume profile is at $0.1450 that is above the resistance of the channel. Therefore there are strong chances that the price action can move up at anytime at least up to the POC level of the volume profile. Because the point of control of the volume profile always works as a center of gravity for the priceline and whenever the candlesticks move up move down it always pulls back the price action towards itself. And if we see the behavior of the priceline since August 2018 up till now then it can be clearly seen whenever the price action moved up or moved down then it always moves back to the POC level.
Here I have also placed the stochastic and momentum indicators. And after placing these indicators we can observe that these both indicators are working in very synchronized manner with Bollinger bands. Whenever the price action hits the Bollinger bands support and stochastic and momentum both give the bull signals together then the priceline moves up to hit the resistance of the channel. Once it was happened on the candlestick of 27th August 2018 and after that the second time it was happened on the candlestick of 9th September 2019. At this time we can see the stochastic is again very close to the oversold zone and momentum is also bearish. Therefore I am again waiting bullish signals from these two indicators for the next bullish rally.

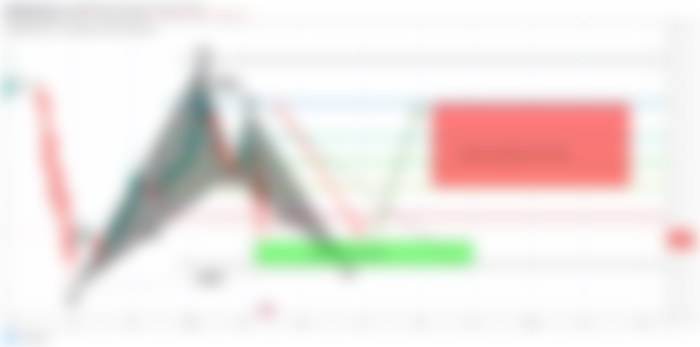
Bullish harmonic BAT signal:
The strongest bullish signal that I have received is that the price line of Chinese Yuan has completed a bullish BAT harmonic pattern on weekly chart. the formation of this harmonic move was started with the candlestick that was opened and closed on 2nd September 2019. And 1st leg was completed on the candlestick that was opened and closed on 28 January 2020. Then the priceline has been retraced upto 0.50 Fibonacci retracement level this was the first confirmation of the bullish BAT harmonic pattern. After this move we needed the Fibonacci projection between 0.382 to 0.886 Fib projection area of A to B leg and we can see that from 17th September 2020 to 9th March 2020 Chinese Yuan projected between this projection level that was the second confirmation for the bullish harmonic BAT pattern.
And finally the priceline is again dropped down and retraced upto 0.786 to 0.886 Fibonacci level and this is a final confirmation of completion of bullish BAT pattern. Now at this time the price action is moving in the potential reversal zone of this bullish BAT and at anytime the price action of Chinese Yuan can move up with a powerful bullish divergence. And as per Fibonacci sequence of sequence if BAT pattern it can be project between 0.382 to 0.786 Fib projection level of A to D leg.

Conclusion:
We can expect buying zone from $ 0.1407 to $ 0.14 because at $0.14 we have strong supports. And realistically sell target can be from $ 0.1423 to $ 0.1448.
If the Chinese Yuan will breakout the channel then we can even expect more powerful bullish rally against US Dollar for years.