Hi folks, hope you are doing good, today I am gonna show you a really very interesting move made by Cardano’s price action. It has formed a series of bullish patterns and formed patterns within other patterns. Therefore this article can be really very interesting for the people who are trading for holding ADA.
Recap:
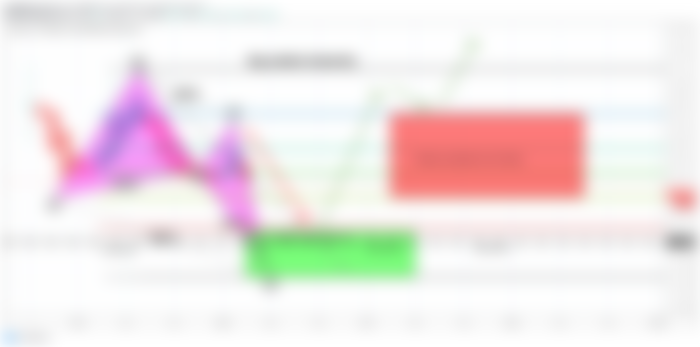
First of all I would like to take you to my old article that I published on 19th August 2019 and on this chart I revealed that Cardano has formed a bullish harmonic Shark pattern. This pattern was started from Feb 2019 and completed on August 2019.
And as per Fibonacci sequence of bullish Shark it was expected that the price action will enter in the Fibonacci projection of C to D leg from 0.382 to 0.786 Fibonacci projection level. If the price action would cross up the 0.786 Fibonacci projection level then it would turn more bullish but unfortunately after visiting the Fibonacci projection area or sell zone the priceline dropped at the support.
Before execution:
After execution:

Dropped on strong support:
At this time we have a strong suppor at $0.027 and we can see so far it is proven very strong support as on 13th March 2020 on daily chart a really very strong and long bearish candlestick tried to break down this support but even after hitting far more beyond this support the candlesticks retraced back above the support zone. It can be expected that the priceline would move at this support level sideways for some more time.

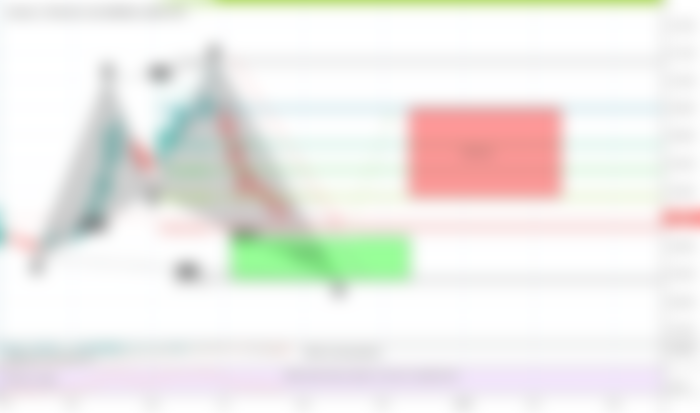
Bullish Crab pattern on 2 day chart:
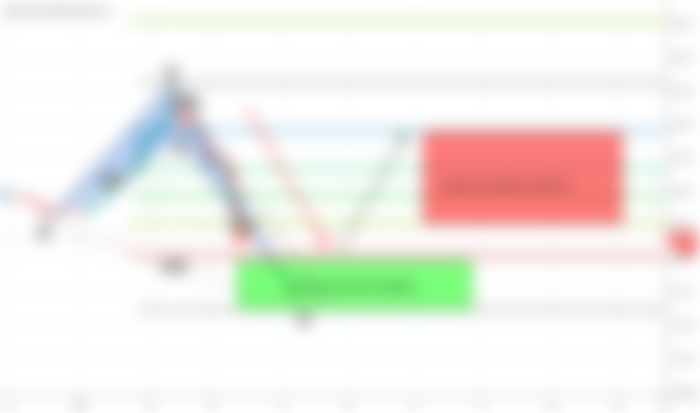
Now let's come to the point that I want to share with you and that is ADA has formed harmonic patterns within other harmonic pattern let's take a look at 2 day chart.
Here on 2 day chart the price line has formed a bullish crab pattern let's have a look how perfect this pattern is formed after initial leg the A to B leg is retraced between 0.382 to 0.618 Fibonacci level and B to C leg is projected between 0.382 to 0.886 Fibonacci projection of A to B leg. After that the last leg is retraced between 1.27 upto 1.618 Fibonacci level. Even though the price action has hit the potential reversal zone and retraced back and has hit the Fibonacci projection area of A to B leg from 0.382 to 0.786 Fibonacci projection but I am expecting that it will be turned more bullish soon and it can even cross up 0.7886 Fibonacci projection level because we have more bullish patterns on log term charts.
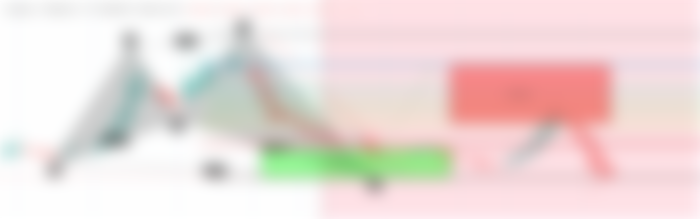
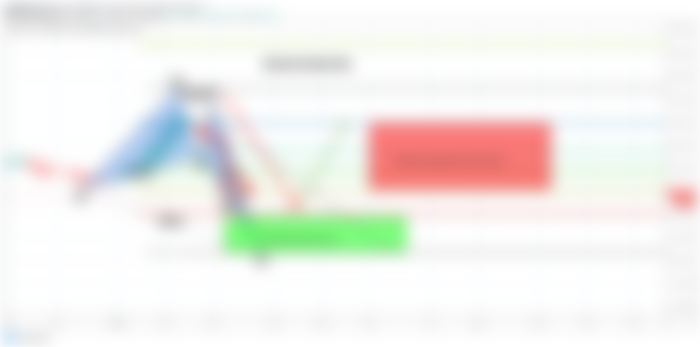
Bullish Butterfly pattern on weekly chart:
Now let's move to the weekly chart where the price action of ADA has formed bullish butterfly pattern. Let's have a look how perfect this pattern is formed. The initial leg was started in December 2019 and completed on Feb 2020. Then A to B leg has been retraced between 0.618 to 0.786 Fibonacci level that is the first confirmation of bullish butterfly pattern. Then B to C leg is moved up between 0.382 to 0.886 Fibonacci projection area of A to B leg and here we have received the second confirmation of bullish Butterfly. Now we can see the recent strong bearish rally has helped the price action to complete the final leg off this pattern and C to D leg is retraced between 1.27 upto 1.618 Fibonacci level. Even though we can see that the price action has hit beyond the potential reversal zone of this pattern but in very next candle the priceline is pulled back and has hit the 0.382 to 0.786 Fibonacci projection of A to D leg. But we can expect that soon the priceline will again turn bullish and we will see some green candlesticks on this weekly chart.
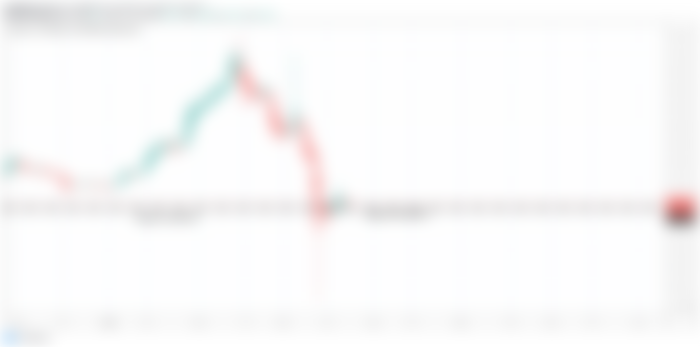
Very big bullish Butterfly on monthly chart:
Now let's move to the more bigger time period chart and that is one month chart. On this long term chart price action of ADA has formed another harmonic Butterfly pattern. The first leg of this butterfly was started on November 2018 and completed on June 2019. Then we can see that the price action has been retraced between 0.618 0.786 Fibonacci level and from November 2019 to Feb 2020 the price action moved up between 0.382 to0.886 Fib projection of A to B leg. Then again the price action dropped between 1.27 upto 1.618 Fibonacci retracement level and here we have a complete bullish Butterfly.
A chain reaction to achieve highest price:

Now we have a series of harmonic patterns. The first one is on 2 day time period. The second one is on weekly time period. And third one is on monthly time period chart. The short time period 2 days pattern can provide the push to the pattern that is formed on weekly chart and the weekly chart parent can provide the strong push to the pattern that has been formed on monthly chart. This move of Cardano will be like a chain reaction. And this chain reaction can produce a very powerful bullish divergence even we can see that the ADA can achieve the highest price ever in the history of Cardano.