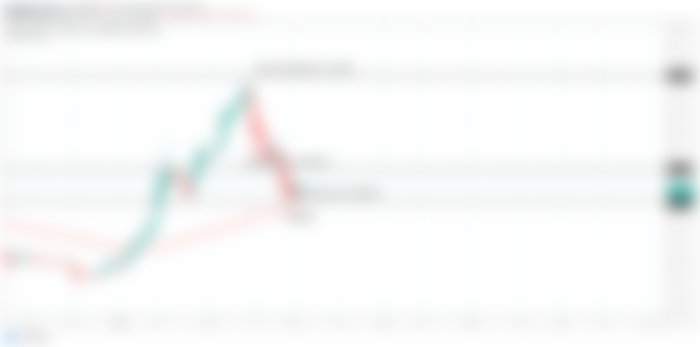
Bounced Back From Key Level Resistance $501:
Hi friends welcome to the new update on Bitcoincash. Guys if you remember I posted an article on 2nd Feb 2020 where I told you that the BCH is going to hit its key level resistance at $501 at that time the price of Bitcoin cash was $378 and then it moved up to $497.53 that was very close to resistance level as I predicted in my previous post. And as I have been telling you that this is the key level resistance for the Bitcoin cash as the Bitcoin cash is not able to break out this resistance level since November 2018 once this resistance level will be broken out then Bitcoin cash can start more stronger rally towards achievement of the highest price in the history of Bitcoin cash for which many traders are waiting.
Below is the link for previous video:
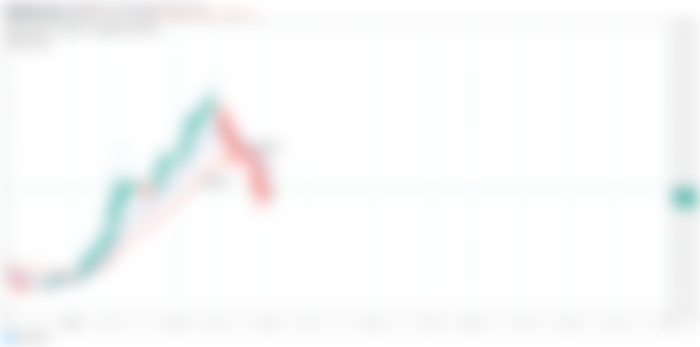
But unfortunately this time again the priceline of Bitcoincash is pushed down by the resistance of $501 in very powerful manner that this time price action even broke down the previous support of $355 and after breaking down this support the Bitcoincash moved back to the next support at $304 again.
At this support level the price action started consolidation and now it is likely to move up again towards the resistance level of $355. Here we also have 100 simple moving average support just beneath the 304 dollar support.

Simple Moving Averages Are In Good Order:
If we see the simple moving averages with the time period of 25, 50, 100, and 200 then sofar they are in good order the 25 simple moving average is above all other moving averages then just below 25 moving average we have 50 moving average after that we have 100 moving average and 200 SMA is just below all these moving averages. Sofar no moving average has formed any death cross with other moving averages. At this time we can see the 25 moving average is showing the tendency to move down to form a death cross with 50 moving average. But this death cross cannot produce the pressure that can lead to breakdown the support.
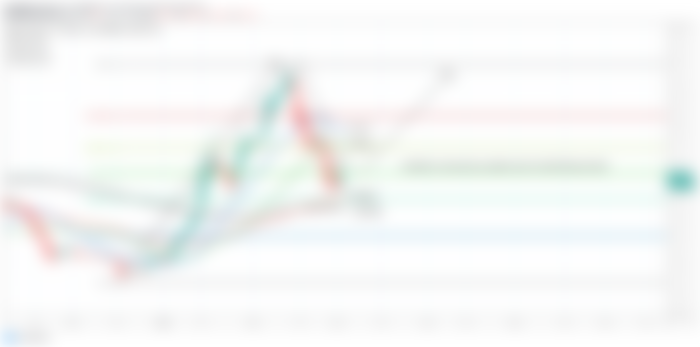
If we place the Fibonacci retracement to from the recent lowest price of $170 up to recent high of $497.53 then we can examine that the price action is retraced up to the golden ratio of Fibonacci level that is 0.618 Fibonacci then it is likely to up from here.The 100 simple moving average is also playing is very important role here as it is just below this golden ratio of 0.618 Fibonacci level to provide a strong support to priceline of Bitcoin cash.

Oscillators And Indicators Are Turning Bullish:
If we see some other oscillators and indicators then we can observe that on daily chart all oscillators and indicators are also turning bullish. For example the price action is getting bounced from the lower bands of bollinger bands and Reletive strength inex (RSI) has already visited the oversold zone and turned bullish now. If we see the stochastic then it can be clearly seen that the stochastic has given bull cross from the oversold zone and moving average convergence divergence indicator (MACD) was strong bearish but now it has also given weak bearish signal and that is also another bullish sign.

We Need The Priceline To Cross Up The Exponential Moving Averages To Back In Rally:
On 2 day chart above exponential moving averages with the time period of 10 and 20 we can see that price action was moving above these EMAs from January 7th up to 18th Feb 2020. But now the priceline has crossed down these eponential moving averages and both EMAs have formed bear cross now it is really very important for the Bitcoin cash to cross up these moving averages again in order back in bullish rally.

A Bullish Harmonic Pattern Is Always Helpful To Move The Priceline Back To Bullish Trend:
Here a very strong bullish continuation signal is appeared and that is the formation of bullish Cypher pattern let's dig this pattern deeper and see how perfect this pattern is formed. Initial leg was started from 25 December 2019 up to 17th of January 2020 then B leg is retraced between 0.382 to 0.618 Fibonacci. Then priceline started B to C leg and projected up to 1.414 Fibonacci projection of A to B leg. Then C leg is retraced between 0.618 0.786 Fibonacci. And this is the Fibonacci projection of X to C leg here formation of bullish cypher pattern is completed and the priceline is moving up. Guys this pattern can be great help for price action of Bitcoin cash to break out $355 resistance.


Ichimoku Cloud Turned More Bullish:
In my previous article we have seen that the ichimoku cloud was turned bullish up to 4 days chart. But now it has turned bullish up to 1 week chart. After crossing up the cloud now the candlesticks are retesting the bearish cloud as support. The lagging span is above the price action and did not cross down the priceline but once it will cross down the priceline then we can see e a bearish trend.
Here I have placed the chop zone indicator and we can see that the chop zone is turned weak bullish before that is was strong bullish from 13th of January upto 24th of February but this week it has turned weak bullish. We need to observe this indicators for next couple of days if it will be turned bullish again then candle sticks with lagging span and conversion and base lines cross up the cloud and then we can see the ichimoku even more bullish.

But if this chop zone will be turned bearish from here then the BCH can face bearish trend.