200 simple moving averaged the strongest support on week chart:
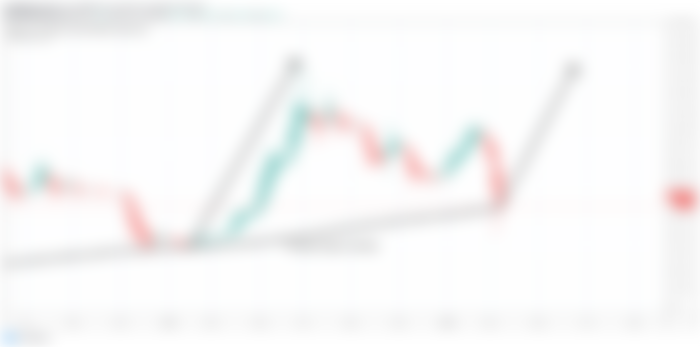
In am in my previous article we have discussed that Bitcoin is hitting the support that is never broken down in the history of Bitcoin. And this is 200 simple moving average of weekly chart. This 200 simple moving average support was first appeared in June 2015 and after that the price action has hit for the first time on this support on December 2018 and after hitting at that support the Bitcoin turned bullish and moved up by more than 300%. Now we can see this is the second candlestick on weekly chart that has hit on this 200 SMA support if the price line will turn bullish as it was tunred bullish in Feb 2019 then it can produce even more powerful rally.

Down trendline and volume profile:
we have also examined that the price line of BTC has formed a down trend line just below the price action. We have so many touches at this trend line therefore this move cannot be ignored. If we move back from January 2018 to February 20 19 then similar down trendline can be seen at that time as well.
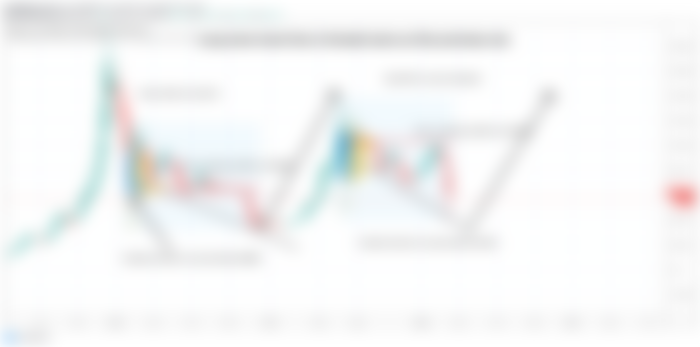
After placing the volume profile on previous downtrend line we can see that the POC of volume profile was at $6500 and the traders interest was very low below $6,000 level. And when the price line moved down where the traders interest was very low BTC turned very strong bullish and even broke out the POC of volume profile as well.
Now this time after placing the volume profile on complete price action moving above the down trendline we can see the point of control is at $10350 and the trader’s interest is shown very low below $7,200. And again the priceline moved at the area where we have very low interest of the traders so there are strong changes that the priceline will again turn strong bullish from here like it was turned in February 2019.

Bullish Crab pattern on strong supports:
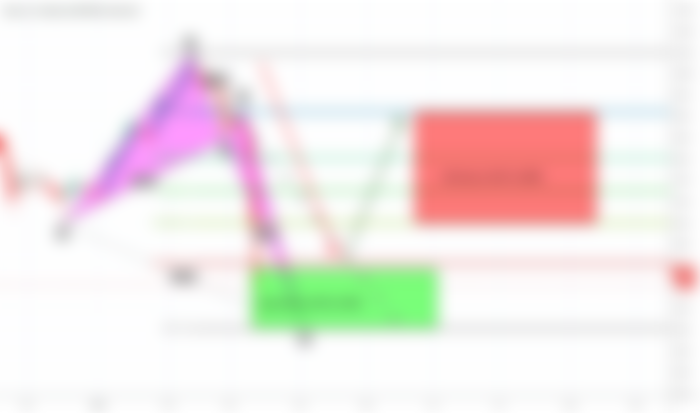
Now if we switch to the 2 day chart then it can be also seen that the priceline of Bitcoin has formed a bullish Crab pattern and this time the priceline is moving in the potential reversal zone of the this pattern. The formation of 1st leg was started on 17 December 2019 and was completed on 12th Feb 2020. And the final leg of this bullish Crab is completed on 11th March 2020. This pattern has been formed on the support of 200 simple moving average of weekly chart and above the down trendline of week chart therefore there are strong chances that the price action can take a powerful bullish divergence from the potential reversal zone of this bullish Crab.

A very big bullish Gartley:
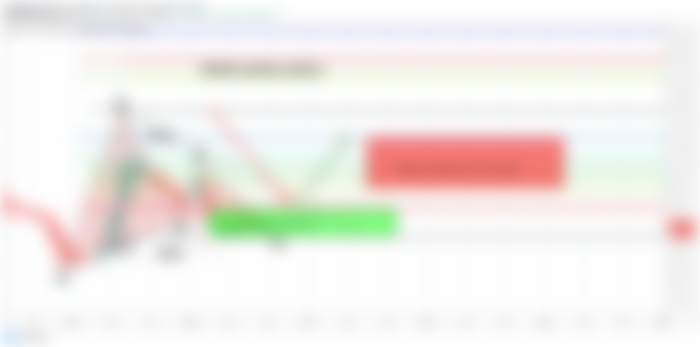
Now if we switch to the monthly long term then it can be clearly seen that a priceline of Bitcoin has a very big bullish Gatley pattern and at this time the BTC is moving in the potential reversal zone of this bullish pattern. Even though the BTC has hit the spike beyond the potential reversal zone of this Gartley pattern but very soon it has retraced back in the potential reversal zone.
The potential reversal zone starts from $7231.72 and ends at $5424.43.
Now from here the priceline can turn bullish and move up to enter in the Fibonacci projection area of A to D leg from 0.382 to 0.786 Fib.
The Fibonacci projection starts from: $8654.00 to $12070.00.

Therefore we can expect almost 127% bullish move from this PRZ level but the maximum extent of the potential reversal zone can be used as stop loss.
Note: This idea is education purpose only and not intended to be investment advise, please seek a duly licensed professional and do you own reaserch before any investment.
