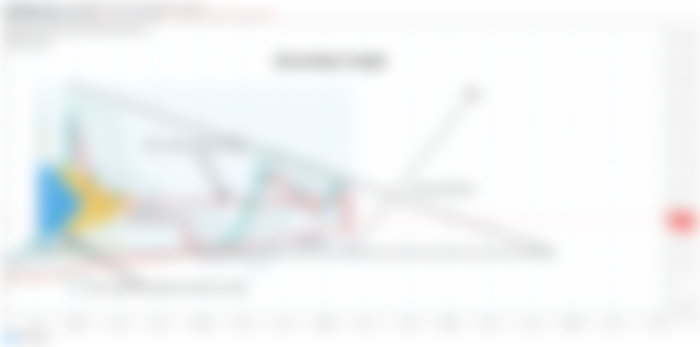
A very big descending triangle:
At this time the Bitcoin is moving in a very big descending Triangle the price action of BTC was entered in this triangle on September 2017.
We have 4 touches at the resistance of this triangle and 4 touches at the support. When last time in Dec 2018 the priceline of Bitcoin touched the support then it turned very strong bullish and moved up to 300% and touched the resistance of the triangle. Now even after this very strong bearish recent rally we can expect that the price line will not hit the support. Because this time we have some other supports above this triangle’s support who are biggest hurdle for the price line to reach the support. Back in December 2018 when the price line was hitting the support of the angle at that time the bollinger band was also at the support in the 200 simple moving average on weekly chart was also at this level. Therefore at that time the BTC had 3 support levels.
1. The Bollinger bands
2. The 200 simple moving average number on week chart
3. The triangle support it self
Now this time if we examine the chart then we have the lower band of Bollinger band and the 200 simple moving average above the triangle support level and these are working as biggest hurdle for the price line to reach the triangle support even though we can see that the candlestick that was opened and closed on 9th March has hit the spike beyond the Bollinger bands and the 200 simple moving average support. But now the candle sticks are retraced back and at this time we are above 200 simple moving average and within the Bollinger bands. That is really very positive move by the price line of the king of all cryptocurrencies.
Now we are at the end of the triangle and the movement of the price line is getting squeezed and the triangle in itself is also getting squeezed. Therefore we can expect a break out from here above the 200 simple moving average in the bollinger bands.
Here I have also used the volume profile and I have placed the volume profile on the complete price range of the Bitcoin moving within this triangle and we can easily see that the traders interest is love below the 200 SMA. Its mean that the traders are not interested to trade even near the support of this triangle and we have a point of control of this volume profile at $8150 therefore we can expect the upwards move by the price line of BTC at least up to this POC level.

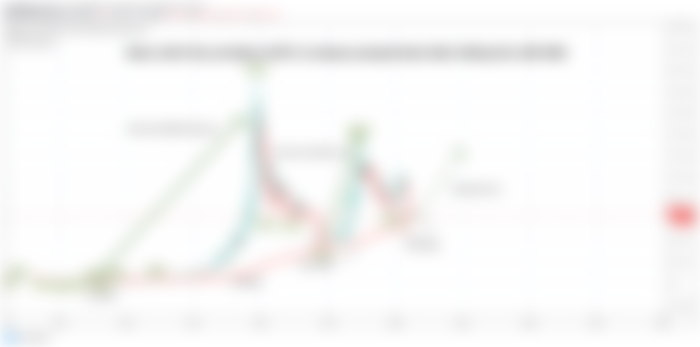
Since 2015 the priceline of BTC is always pumped hard after hitting the 200 SMA:
Now let's come to the point that we have already discussed in my previous posts that the BTC is at its strongest support ever that is not broken down since it is appeared in the history of the Bitcoin and that is 200 simple moving average. On below chart after zooming out we can clearly examine that after 1st appearance of 200 SMA first time price action has has touched on the 200 simple moving average support in June 2015 and turned very strong bullish and moved up by 8900%. At that time the price line of BTC was also at its pivot low point. Then the pride line of Bitcoin retraced down and touched 200 simple moving average support on December 2018. At that time the BTC was at its pivot low point $3122 dollars and again turned very strong bullish and moved up by 300%.Now at this time we have seen that from Feb to March 2020 the price action faced strong bearish move and this is for the third time in the history of the leading cryptocurrency the candlesticks are hitting on this support. Even though the priceline has hit beyond the 200 SMA but retraced back again. So this time we can expect and other bullish move.

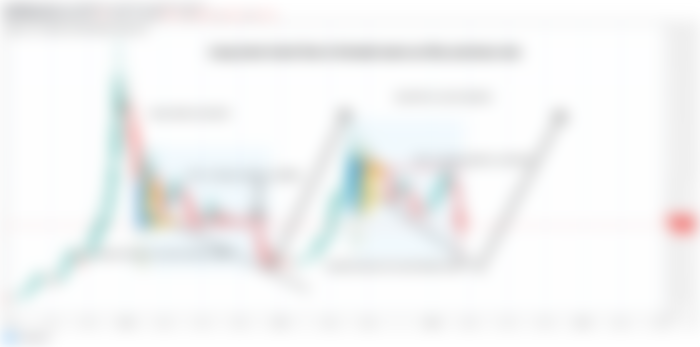
Down trend line repetition of previous move:
In my previous articles we have seen that Bitcoin has formed a down trend line on long term weekly chart. This trend line cannot be ignored as the priceline of BTC has so many touches at this level.
The BTC has started moving above this trendline from July 2019 and this time the priceline of Bitcoin is again hitting at the trendline support. I have placed the volume profile on the complete price action moving above the trendline , now we can examine that the point of control of the volume profile of complete price action moving above this trendline is almost at $10350.
And as discussed earlier in my previous articles we have noticed that POC works as center of gravity for the price action and it pulls back the price action towards itself whether the priceline is moving up or down. And after placing this volume profile on complete price action we can also examine that interest of traders is very love below $7,200 therefore I was expecting that a price action will not touch the support of trendline or if it will hit at the support of the trendline then there are possibilities that the priceline will move up again towards point of control level.
If we see charts back in 2018 to 2019 then it will be revealed that same as like this trend line a downtrend line was formed after the market crash of 2017. The formation of that trendline was started in March 18 and ended in February 19 for almost a year. The point of control of volume profile was at $6500 and the traders interest was very low below $6,000 level. And when the Bitcoin moved down from that level then priceline took a very powerful bullish divergence and moved up by more than 300%.
So this time this trendline is another support added that is not letting the price action to reach the triangle’s support.

If the priceline moves up then what should be the targets:
Now here the question comes in mind if the price action starts a bullish rally from here then what should be our sell target? Here I would like to suggest that we can set two types of sell targets.
1. Type of target: As we have seen that the price line is moving in a a very big descending triangle on weekly chart and if we place the Fibonacci from the tail of the triangle upto the support then we can see that we have the Fibonacci projection from point 0.382 to 0.786 Fib level that is $9300 to 16000.
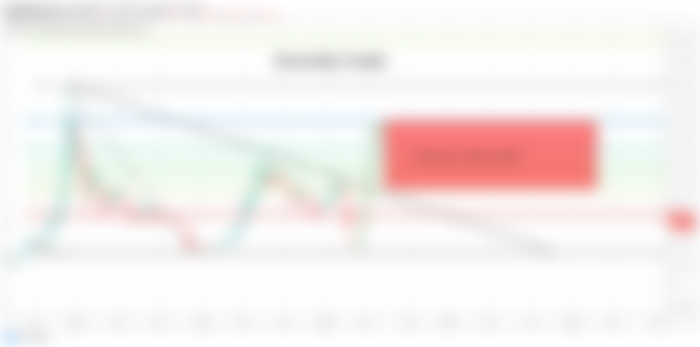

2. Second type of target: As in my previous posts we have already observed that the price line of Bitcoin has formed a really very big bullish Gartley pattern. So we can also set sell targets according to the Fibonacci sequence of this Gartley. And that is if we place the Fibonacci retracement to from a A to D leg of this pattern. The we receive the Fibonacci projection from 0.382 to0.786 Fib level starts from $8654 dollars and ends up to $12070 and we can set our target in this bracket.
However if the price action breaks out the resistance of the triangle or crosses up the 0.786 projection of A to D leg of Gartley then it can turned even more strong bullish.

Conclusion:
We have very strong supports and very low chances that the BTC will be dropped more from here. We can have some sideways move at this level and sooner or later we will be moved up from this level however the 200 simple moving average support is the most strongest support in the history of the Bitcoin therefore we should use this as our stop loss.