Finally Having Bounce From 200 SMA And Support of Down Channel:
Finally on daily chart the price action of Bitcoin is taking bounce from 200 simple moving average. As in my previous post we have seen that first the price action was moving in an upchannel from Dec 19 2019 up to 20 Feb 2020 then Bitcoin broke down the support of this channel and now it has formed down channel.
The Bitcoin embraced the support of down channel and after hitting the spike at the support of the channel and on 200 simple moving average the price action is likely to take the bullish divergence and now moving towards resistance of the channel.

Oscillators And Indicators Are Turning Bullish:
In the meanwhile we can see that the priceline is taking bounce from the lower bands of Bollinger bands and moving average convergence divergence (MACD) is turned weak bearish from strong bearish and we have also received a bull cross from stochastic from oversold zone and the relative strength index (RSI) has turned bullish after visiting the oversold zone.


Harmonic Pattern A Rescue Volunteer:
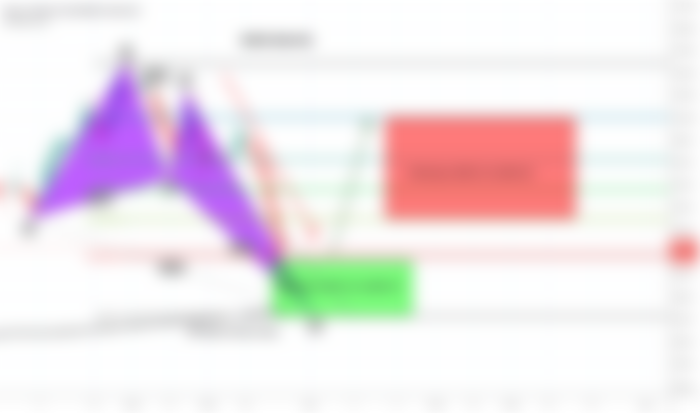
In my previous post we have seen that on 12 hour chart the Bitcoin formed a bullish butterfly pattern. And 200 simple moving average was already waiting in potential reversal zone for priceline to provide it support when the price action will be entered in this PRZ area. And when the price action entered in this zone the BTC took bullish divergence without hitting the 200 SMA.
And now the Bitcoin is above the potential reversal zone and moving upwards to enter in the Fibonacci projection area of A to D leg of this Butterfly between 0.382 to 0.786 Fibonacci levels which is $9093 to $10000.
But once the Bitcoin will manage to close above the 0.786 Fibonacci projection level then this level will become a strong support for the priceline of BTC then there will be more chances that the Bitcoin will again try to continue the bullish rally.

Have A Cup Of Tea A Bullish Continuation Signal:
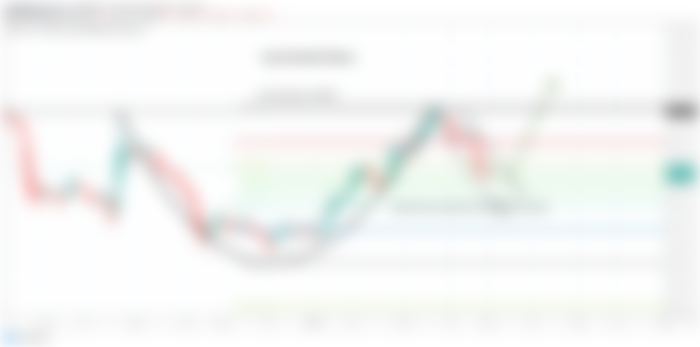
Now back on the daily chart we have already seen that the Bitcoin has formed a perfect Cup & Handle pattern and the resistance of this cup is at $10350 and if the Bitcoin will break out the resistance of the handle then there are more than 80% chances that the price action will also break out the resistance of the cup as well which is at $10350.
And if the Bitcoin will manage to break out the resistance of the cup then this resistance can become very strong support for the priceline and Bitcoin may continue the bullish rally which was started since 18 December 2019. And the chances of breakout are really strong because this cup & handle pattern in is also known as bullish continuation pattern.

A Long Term Trend Line Is Formed:
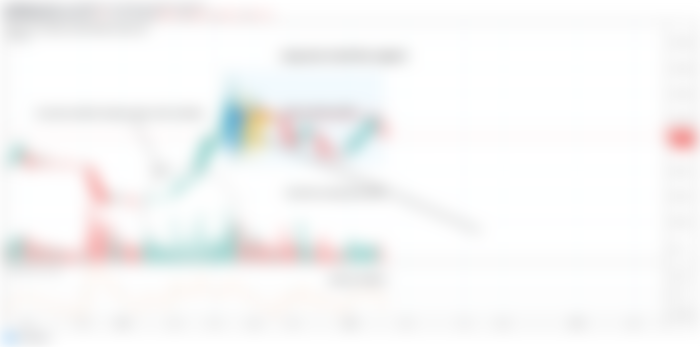
Now let's watch the price action of BTC on long term weekly chart and it can be easily examined that a trend line has been formed below the price action moving downwards is formed. If we place the volume profile fixed range on complete price action above this trendline then as result we receive that at this time the trader’s interest is above the trendline support that is really optimistic signal.
The POC of the volume profile is at $10350 this is the same level where we have the resistance of the cup & handle pattern. Since the BTC is moving above this trend line it is moving around the POC of the volume profile. Guys we need to breakout the POC as soon as poosible because if we will have more touches at POC or close to this level then a long term trendline above the priceline of BTC will be formed then it will also lead to the formation of down channel and once the down channel will be formed then it will be difficult for the price action to break out the resistance of this channel and moving within this down channel the priceline may 1st hit the $8314 support and then $6500 previous support.
And in order to break out the POC of this volume profile we will need a buying volume with the continuation like we had from Feb 11 2019 to 24th June 2019 and volume oscillators should be triggered in the favor of bulls having more than 10 value.

Exponential Moving Averages:
We have also seen in my previous articles that the price action was moving above the exponential moving average 10 EMA 20 since the Bull rally was started from 18th of December 2019 to 22nd Feb 2020. At this time we can see that the EMA 10 has formed a bear cross with exponential moving average 20 and the price action has crossed down the EMA 10 and 20 both. Here moving average convergence divergence (MACD) and stochastic are playing very important role. Stochastic is entered in the oversold zone and so far it is in bear cross and moving average convergence divergence (MACD) is also strong bearish once the MACD will be turned weak bearish and the stochastic will give bull cross from oversold zone then there will be more chances that the priceline of BTC will cross up the EMAs 10 and 20 then these exponential moving averages will become strong support for bitcoin. Sofar we have received a bull cross from stochastic and MACD is also turned week bearish upto day chart therefore I am expecting that soon these bullish signal will be reflected up to 2 day chart as well.
Guys as soon the Bitcoin again crosses up these EMAs as soon it will be back again in the bullish rally.