Hi friends, hope you are well and welcome to the new update on Bitcoin.
Bullish Cypher move:
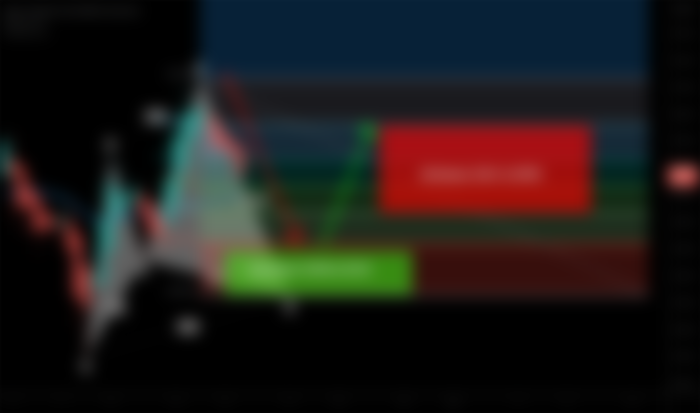
A few days back I shared an idea with you when the Bitcoin was likely to complete the final leg of the bullish Cypher pattern. Finally, after breaking down the 25 daily simple moving average the price action completed this pattern and entered the potential reversal zone of Cypher. Even though we had some candlesticks closed below the buying zone, but very soon the price has reversed bullish, and now it is moving to the upside.

After the completion of Cypher pattern:

You can also support my work at Patreon:
https://www.patreon.com/moon333
BTC hits weekly 50 SMA:
If we take a look at the weekly time frame char, then this time a big event is going to be triggered because the price line of Bitcoin reached the 50 simple moving average and this is happening the fourth time in the history of Bitcoin. Every time the Bitcoin has been starting the correction rally and sometimes the big rallies to the upside after hitting the weekly 50 simple moving average. Therefore this time we can expect and another correction or a big move to the outside.

This indicator can give final confirmation:
Even though the price action has been bounced by the 50 simple moving average on the weekly time frame chart but I would like to take another confirmation from the directional movement indicator with the combination of exponential moving average 10 and 21on the daily time frame chart. This can be the final confirmation for the starting of the bullish season again. On the below chart, the DMI indicator can be seen. The blue line of the directional movement indicator represents the bulls also called +DI and the orange line represents the bears also called –DI. Whenever the blue line crosses up the red line that is the buying signal and if the orange line crosses up the blue line that is the sell signal. The ADX (Redline) shows the power of bulls or bears. If the orange line is above the blue line then ADX shows the power of bears and if the blue line is above the orange line in that situation the ADX shows the power of bulls. Previously we can see that whenever the exponential moving average 10 crosses up the exponential moving average 21 and directional movement index gives the buying signal then the price actions starts a powerful rally to the upside. This time again the EMAs 10 and 21 are very close to forming a bull cross and the blue line of the directional movement index has started moving to the upside while the orange line is also moving to the downside to form the bull cross or buying signal. At the same time, the ADX is moving down which is showing that the bears are getting weaker. Once we will receive the buying signal by DMI and EMAs simultaneously, and the price action would be above the weekly 50 SMA then it would be the final signal for the bullish season again.

Conclusion:
The price action of the leading cryptocurrency has bounced well from the 50 simple moving average on the weekly time frame chart. And it has never happened in the history of the BTC, that after reaching the weekly 50 simple moving average it has not started the bullish move. Therefore this time we can expect another bullish move to the upside. However, for the final confirmation, we can also keep an eye on some additional indicators like I have shown in this article in order to minimize the risk factor.
You can also support my work at Patreon:
https://www.patreon.com/moon333
In order to play and watch the current performance of the chart you need at least a free account on tradingview:
https://www.tradingview.com/gopro/?share_your_love=moon333
KuCoin is one of the best exchange to find crypto gems:
https://www.kucoin.com/ucenter/signup?rcode=rJSDVT3
Link for Binance exchange, to trade crypto:


