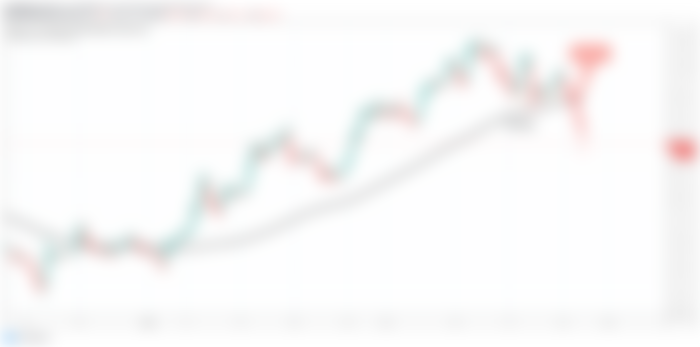
Breaking Down 200 SMA And Stop Loss:
On 4 hour chart the price action of leading cryptocurrency was moving above the 200 simple moving average since 3rd January 2020 and finally hit at 200 SMA on 19th Feb 2020.
After taking bounce from 200 simple moving average everyone was expecting that this time the priceline will be moved up to next resistance level AT $11000.
Therefore in my previous article I have suggested to use this 200 simple moving average as a stop loss and unfortunately on 25th of February the price action broke down this 200 SMA and the stop loss was triggered.

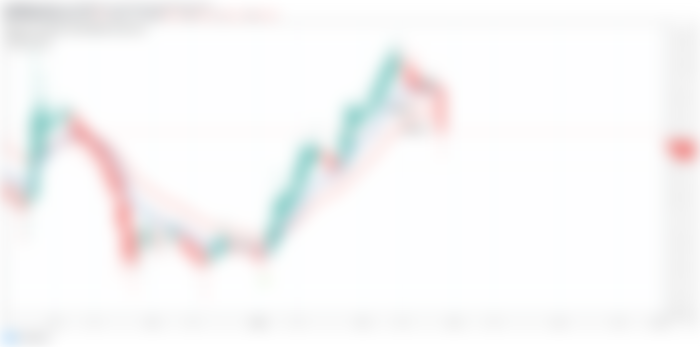
Exponential Moving Averages:
on 2 day chart the priceline was moving above the exponential moving averages with the time period of 10 and 20 and worked as strong support for the price line from 9 Jan to 16 Feb. On 23rd Jan price action has hit the EMA 10 but the EMA 10 pushed the price action up and now finally the price line again has hit the EMA 10 and 20 both and likely to break down these EMAs.
So far the priceline did not break down both EMAs and once the priceline will manage to move above these EMAs again then we can see a new bullish rally by Bitcoin’s price action.

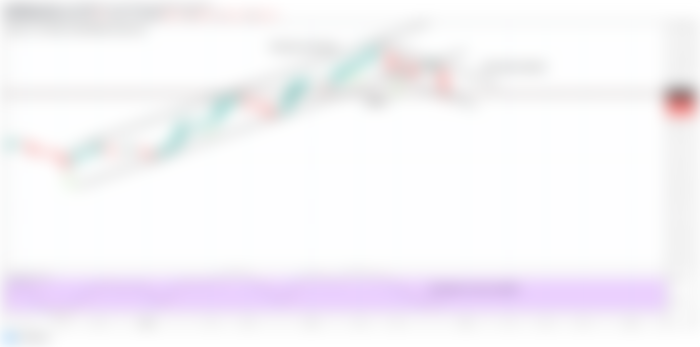
After Breaking Down The Channel A New Channel Has Been Formed:
The price line was moving in up channel since 18th December 2019 and now this channel has been broken down on 21st of February. After breaking down this channel the priceline has formed a down channel sofar the movement within this down channel is very smooth and at this time the price action of Bitcoin is hitting at the support of this down channel and also touching at the support which was formed on 4th of February by the price action recently. The Stochastic is very closed to oversold zone therefore I am expecting if the stochastic will give bull cross from here then we can see that the price action will move up to hit at the resistance of this channel almost $7000.

Simple Moving Averages And Supports:
If we see the simple moving averages with the time period of 25 , 50 , 100 and 200 then we can see at this time the price action has broken down the 25 SMA and now hitting at the 50 simple moving average and at the support of the down channel which we have discussed earlier therefore this support has become more stronger more over the price action has also hit the spike up to 200 simple moving average this is also another very strong support infact every moving average is support for the priceline. Once this moving average will be broken down then we can see that the price action will hit the previous resistance level which is now working as a support at $8314.
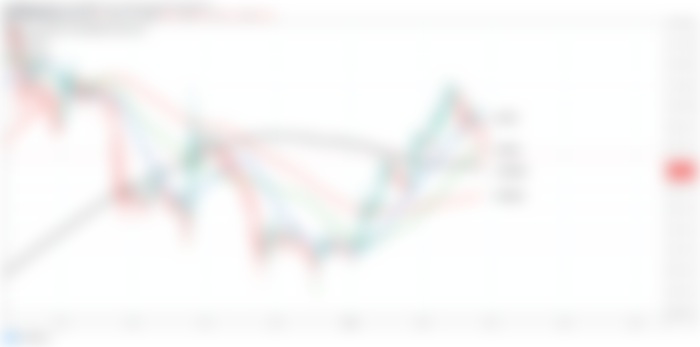

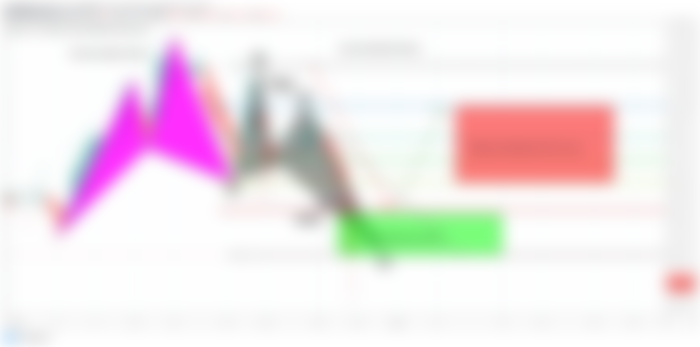
A New Harmonic Move Can Repeat The Bullish Move:
We had a bearish trend from 13th Feb upto 17th Feb 2020 then we have seen that the priceline of Bitcoin formed a bullish Cypher pattern and entered in potential reversal zone then from this zone Bitcoin moved up to $10,300. Same as like that the price action is again in a bearish trend and at this time it has again formed another harmonic pattern that is Butterfly and the price action has entered in the potential reversal zone of the bullish Butterfly pattern. And this time the priceline is again expected to do the same as it has done in the previous history when it was in bearish trend and formed the bullish Cypher pattern. If the price action will be stopped moving down at this potential reversal zone and the candlesticks will be consolidated within this potential reversal zone then soon we can see that the BTC will take a powerful bullish divergence which will lead it at least up to the Fibonacci projection of A to D leg of this bullish Butterfly pattern from 0.382 up to 0.786 Fibonacci level from $9467 to $10000. And if the priceline will be able to cross up the 0.786 Fibonacci levels then we can see that the price action of Bitcoin can achieve the next resistance level at $11,000. Therefore today’s candlestick is the decision maker if the candlesticks won’t be stopped here for consolidation within this potential reversal zone and at the support of the channel and on 50 SMA then the price action may find the support at $8314.

I will keep sending more updated on BTC price action when receive more developments.