Hi friends, and welcome to the new update on Bitcoin (BTC).
Parallel channel:
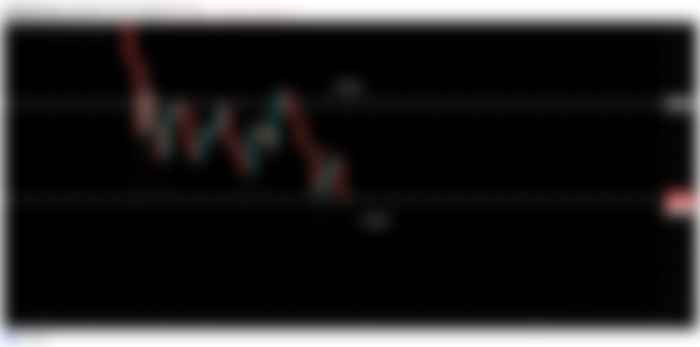
On the daily time frame, the price action of Bitcoin has found a price-level resistance at $39500 and horizontal support at $31000 and moving between resistance and support very well since after the 19th of May 2020 this move of the Bitcoin has formed apparel channel.

Descending triangle:
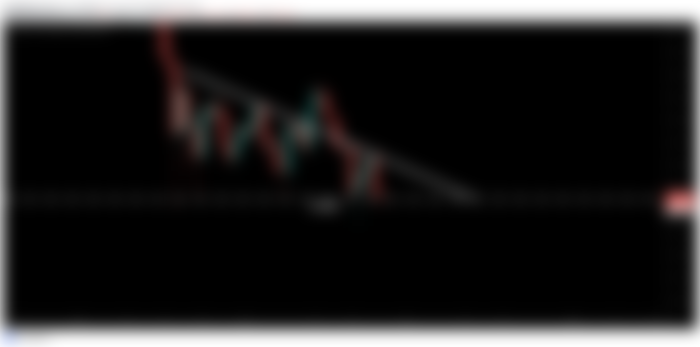
At the same time, the price action has also found a down trendline resistance that is working as a rejection line again and again. The price action is not able to break out this resistance so far. The support of $31000 and the downtown and trendline resistance has also formed a descending triangle .

Head & Shoulder pattern:
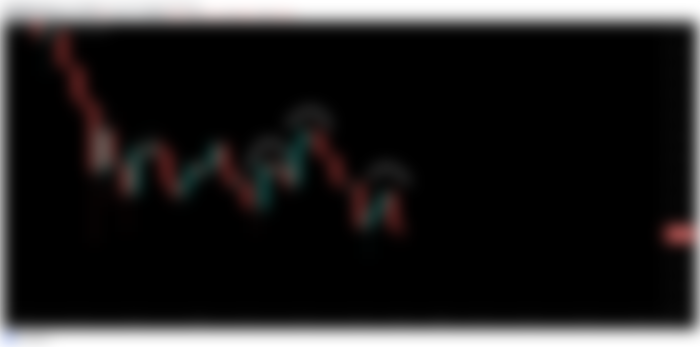
On the daily timeframe chart, while the price action is moving between a parallel channel and in the descending triangle, it has also formed a Head and Shoulder pattern. We can see a left shoulder then a head is higher than the left shoulder and the right shoulder is lower than the head.

Volume profile:
While the price action has formed a Head and Shoulder pattern which is a bearish reversal move, at the same time if we place the volume profile on the complete price action moving within the triangle then it can be clearly seen that we have a very low interest of the traders at the support of the triangle and a high interest of the trader's interest even above the resistance of this pattern. The point of control of the volume profile is also above the resistance of this descending triangle that is indicating the breakout.

Long term Key support area:
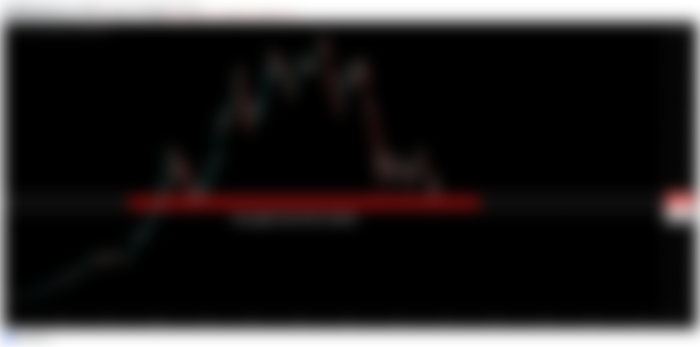
if we zoom out the chart, then we can see that the price action found a support at $28800 in the month of January 2021 after a long time the pricelilne of the leading cryptocurrency is again at the same level. Therefore, we can consider the area from $31000 to $28800 as a key support area in the long term. If the weekly candlestick will be closed below this level then Bitcoin can start a long-term bearish trend . However, so far the price action is not able to close even below $31K on the daily time frame chart.

Volume oscillator and MACD:
Now if we take a look at that the volume oscillator on the daily time frame chart that shows the power of buy and sell volume, then it can be clearly observed that we have volume oscillator triggered for the buyers only and while we are observing the sell, the volume oscillator is moving down and at the same time, the MACD on the daily time frame is also in an uptrend that is another bullish signal.

Conclusion:
Even though the Head and Shoulder pattern has been formed on the daily time frame chart, which is considered as a bearish reversal pattern. However, if we take a closer look then it can be noticed that the price action of the king of all cryptocurrencies is testing the resistance of the patterns more than the support. And the more we will test the resistance or support, the more there will be chances for the breakout or break down the resistance or support respectively. And the volume profile is also showing very low interest at the support and the wicks of the candlesticks are also showing the true story, that the bears are very weak at this level.
You can also support my work at Patreon:
https://www.patreon.com/moon333
In order to play and watch the current performance of the chart you need at least a free account on tradingview:
https://www.tradingview.com/gopro/?share_your_love=moon333
KuCoin is one of the best exchange to find crypto gems:
https://www.kucoin.com/ucenter/signup?rcode=rJSDVT3
Link for Binance exchange, to trade crypto:
https://www.binance.com/?ref=11256882
Note: Above idea is for educational purpose only. It is advised to diversify and strictly follow the stop loss, and don't get stuck with trade.
