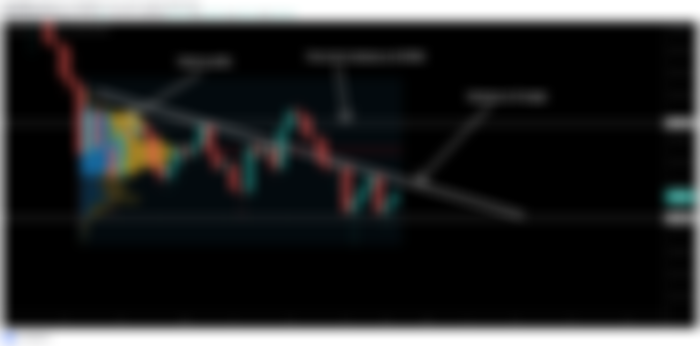
Bounced from the support:
The price action of the leading cryptocurrency is moving in a descending triangle and at the same time, it is moving between the resistance and the support levels from $31K to $39.5K. Previously we have been watching that the volume profile of the complete price action is showing that there is a weak interest of the traders close to the support and showing a strong interest of the traders even above the resistance of the descending triangle . The price action followed this signal and again bounced by $31000. It is to be noticed that so far we are not having any closing below the $31K support level on the daily time frame chart.

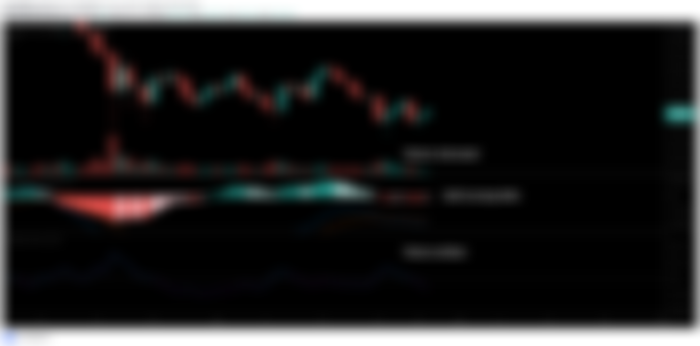
Different indicators are giving bullish signals:
If we take a look at the volume then it can be noticed that even though the priceline of Bitcoin reached the support $31000 but the sell volume was not powerful. Finally, the price action is getting bounced by the support. After placing the MACD indicator on the chart, it can be observed that the MACD has started turning bullish . Previously when the MACD was turning bullish in the same way the price action reached the resistance of the triangle and got rejected. Therefore this time we can expect that the priceline of BTC will follow the signal of the MACD indicator and it will make another attempt to break out the resistance of the triangle. The volume oscillator is still moving down after getting triggered two times by the buying volume . It’s mean that the recent sell did not cancel the buying signal of the volume oscillator.

Weekly EMA:
In case Bitcoin breaks out the resistance of the triangle it can also break out that EMA 21 on the weekly time frame chart. Once the priceline of the Bitcoin will break out 21 weekly then there can be a high buying volume observed, which can lead the price action to continue the mega bull run.


Conclusion:
The triangle is getting squeezed. Therefore, it is a make or break time for the price action of the king of all cryptocurrencies. If the support of the triangle will be broken down, then another bearish rally can be triggered. However, most indicators are in favor of break out. In case of breaking out, the price action can continue the mega bull run.
You can also support my work at Patreon:
https://www.patreon.com/moon333
In order to play and watch the current performance of the chart you need at least a free account on tradingview:
https://www.tradingview.com/gopro/?share_your_love=moon333
KuCoin is one of the best exchange to find crypto gems:
https://www.kucoin.com/ucenter/signup?rcode=rJSDVT3
Link for Binance exchange, to trade crypto:
https://www.binance.com/?ref=11256882
Note: Above idea is for educational purpose only. It is advised to diversify and strictly follow the stop loss, and don't get stuck with trade.