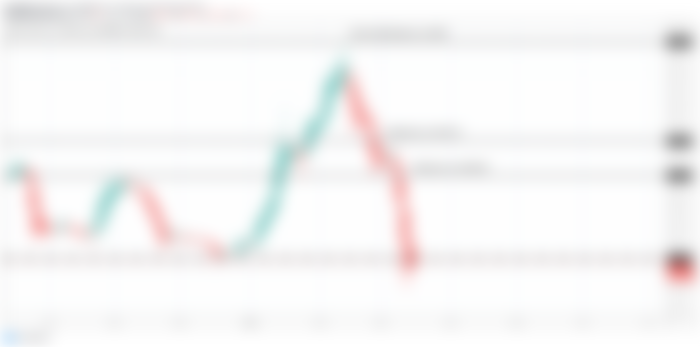
Failed in breaking out the key level resistance:
The Bitcoin cash had started is very powerful bullish rally in December 2019 after breaking out the first resistance level at $304 the price action used this resistance as support and using this support the price action moved up to make an attempt to breakout the key level resistance of $501. After reaching at $497 the price action turned very strong bearish and broke down all previous supports and at this time the price action of Bitcoin cash is at $182 support.

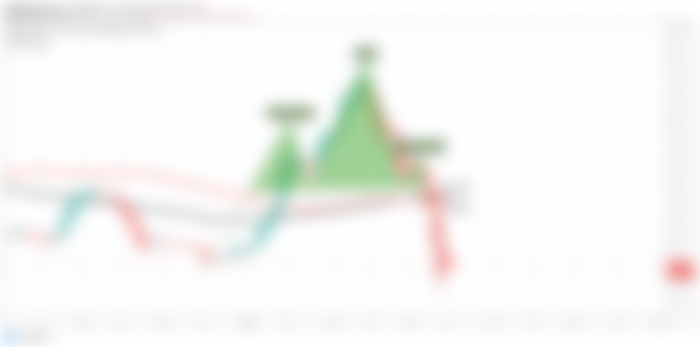
Head & Shoulder pattern and breaking down the SMAs supports:
If we closely examine the 2 day chart then it can be clearly seen that the main reason for this drop was the formation of Head and Shoulder pattern. This pattern was started with the strong bullish rally of Bitcoin cash in Dec 2019. The left shoulder was completed on January 3rd 2020 and the head was completed on Feb 28. After hitting the key level resistance of $501 the price action formed the right shoulder from 28th February to 7th March 2020 and even broke down the neckline of the Head & Shoulder. While forming the right shoulder we had strong supports of 100 and 200 simple moving averages but the sell off was so much strong that the price action easily broke down these two supports as well.

The priceline is using the support of resistance of previous pennant:
Here I would like to take you back on 23rd December 2019 when I reveled in my post that the price action of Bitcoin cash was moving in a pennant. This movement in the pennant was started on 21st June 2019. And when I published that article the priceline was getting bounced from the support of that pennant and based on some more indications I predicted that this time the BCH will breakout the resistance of the pennant. And on January 2020 the price action broke out the resistance of the pennant. This trade Idea produced more than 154 % massive profit.
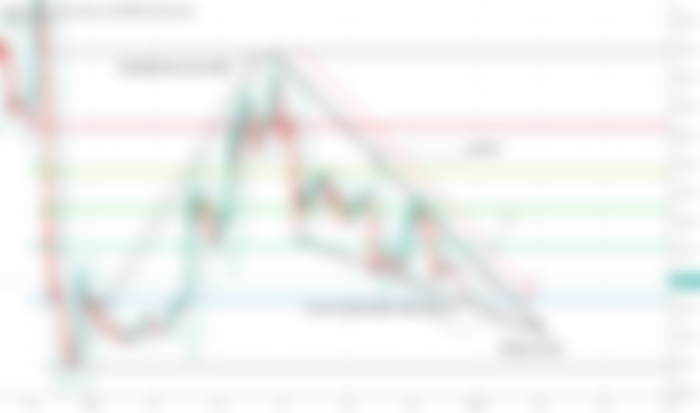

Formation of new harmonic Shark pattern a bullish reversal signal:
But now we can examine that priceline is retraced 100% and this time the price action of Bitcoin cash is also having the support of previous trend line that was the resistance of the pennant.
If we observe on 4 day chart then it can be clearly seen that the priceline of Bitcoincash has formed bullish Shark on the support. The formation of this pattern was started in December 2019 when the Bitcoin cash started its rally. The first leg was completed on 17th January 2020 at that time the priceline of BCH retraced between 0.382 to 0.6 18 Fibonacci level. That was the 1st confirmation of bullish Shark. From here the Bitcoincash was the suppose to be projected between 1.13 to 1.618 Fibonacci level of A to B Fibonacci projection area for the completion of B to C leg of this shark pattern move. At C leg’s level we have some extra spike that I have ignored because all other legs are formed as required for the perfect bullish Shark pattern. After the completion of C leg on 14th February 2020 the priceline of BCH faced strong sell off and this bearish move helped the priceline in completion of final leg of shark pattern. And now we can see that the priceline of Bitcoin cash has retraced between 0.886 to 1.13 Fibonacci level and moving in the potential reversible zone of this pattern. From this potential reversal zone the price action of BCH is suppose to take the bullish divergence in the Fibonacci projection of between 0.382 to 0.786 Fibonacci projection of C to D leg.
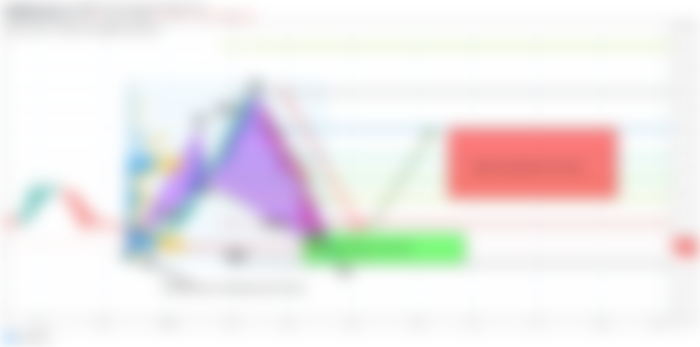

The ranges of potential reversal zone and Fibonacci projection are as below:
Potential reversal zone is from: $ 196.83 to $ 139.48
The Fibonacci projection area is from: $ 266.47 to $ 401.14
Above range depicts that this pattern can produce upto 188% massive profit rally.
Stop loss:
The volume profile of complete price action of Shark pattern is showing the traders interest even in the PRZ level therefore we need to take care of stop loss strongly in this case we can use the maximum extent of potential reversal zone that is $ 139.48.
Because if this potential reversal zone will be broken down then priceline can turn more bearish.