As my previous post we have seen that on hourly chart, 30 March after hitting the recent lowest price at $5856 the Bitcoin moved up by 13% in less than 24 hours. And the candlesticks were being consolidated at this level and formed bull flag at this level. When I published my previous post the price action of BTC was retraced between 0.382 to 0.50 Fibonacci retracement level as below:
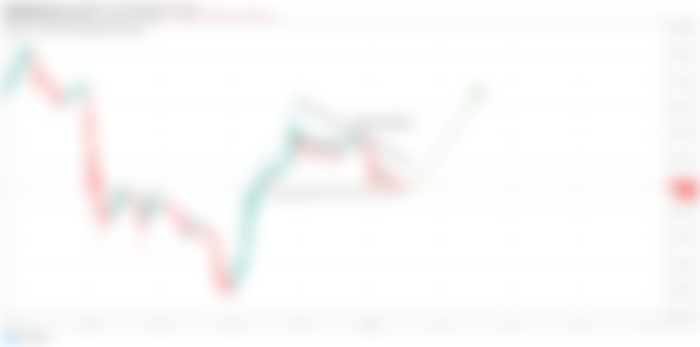

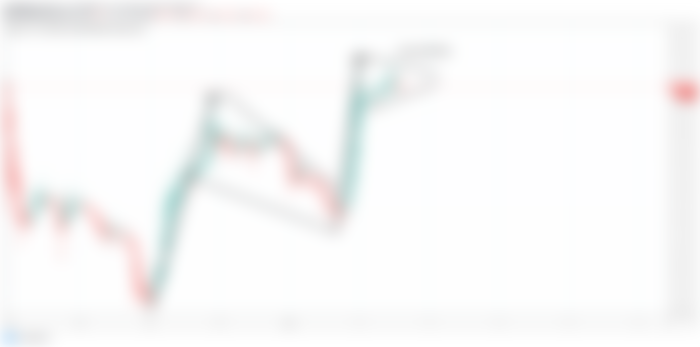
After that the price action moved more down upto golden ration and rertaced between 0.50 to 0.618 Fibonacci and moved up with powerful bullish divergence and now it is likely to form the second bull flag.

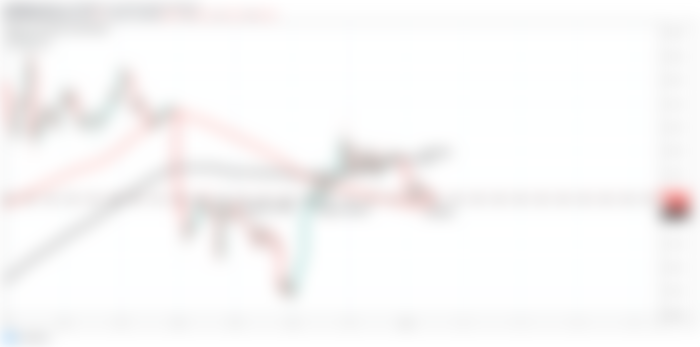
Bitcoin has broken out the SMAs resistance successfully:
Now on this hourly chart the BTC is in more powerful position than yester day as yesterday the Bitcoin found the short term support at $6290 and it was moving above this support. Moreover candlesticks had also broken out the 100 simple moving average and at that time this 100 SMA was also another short term support for BTC , Here the Bitcoin was likely to sustain this level very wel and we needed the closing above 200 simple moving average and at that time the 200 SMA was at $6454. As discussed previously once the price action would be closed above this level then we would witness further upward move And the Bitcoin has done so.
Before breakingout the 200 SMA:

After breakingout the 200 SMA:
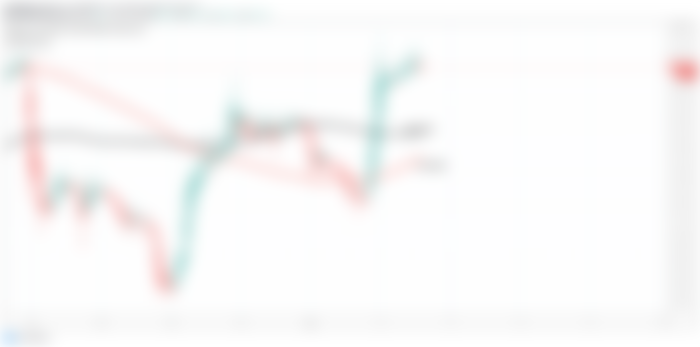

We need this move or breakout:
On the same hourly chart the priceline was moving in a wedge since 20 March 2020 and yesterday the BTC was at the center of this wedge . There were more chances to have a break out rather to break down because at that time the resistance of the wedge was at $6800 and in order to break out this resistance we needed the closing above 200 simple moving average. Now the price action has broken out the 200 SMA and has attempted to breakout the resistance of wedge. At this time the Bitcoin is at being consolidated near the resistance of this wedge having supports of 100 and 200 SMAs and Bollinger bands is also moving up aggressively.

Once the BTC will be able to breakout this resistance of Wedge then it can start more powerful bullish move that could be seen even on the bigger time period charts as well.
Note: This idea is education purpose only and not intended to be investment advice, please seek a duly licensed professional and do you own research before any investment.