Should You Be Selling Your $SPS Tokens? | Splinterlands #130

Two weeks ago, I published a technical analysis post on the $SPS token. I was concerned with the bearish market structure and a potential rising wedge forming. Since the post, the price of $SPS has decreased from $0.87 to a current price of $0.50. In the post, I also mentioned the analysis was limited due to using the charts available on coingecko. But recently discovered Gate.io exchange where $SPS token is traded on trading view esque charts available. I want to explore using my three favourite technical analysis indicators on the $SPS token in this post. https://leofinance.io/@mercurial9/splinterlands-sps-technical-analysis-or-splinterlands-126 Technical Analysis Pre-amble I am not going to go into the fundamentals of the different indicators. I have written an entire series on the building blocks of technical analysis, and this summary post has all the articles linked if you would like to brush up on your knowledge. https://leofinance.io/@mercurial9/building-blocks-of-technical-analysis-a-summary-post I prefer to use higher time frames (weekly and monthly) when doing technical analysis, but as the $SPS token has only three months of market data, we will use the daily chart data. Some others prefer to use 4hr timeframe, but it's too noisy for me. Moving Average Convergence Divergence (MACD) The MACD is one of my favorite signals to use as it acts as a warning signal that new trends, whether bullish or bearish, are on the horizon. The gist is when the MACD rises above the trigger line, it's a buy signal, and when the MACD is below the trigger line, it's a sell signal.

Using the daily chart data, on 18th October, the MACD (purple line) broke below the signal (red line), and probabilities pointed to a bearish market structure, which we have seen play out in the price action of the $SPS token. Also, the MACD continues to point to a bearish trend. On Balance Volume (OBV) Initially a popular signal, but you don't see it as often in the mainstream technical analysis as much over the past few years. I like to use it as it focuses on a critical concept: volume precedes price. If we see volume rising on a coin, it may indicate 'smart money' moving into the coin. The numerical value of OBV is not of interest but rather the trend of the OBV line.

From the chart, the trend of the OBV line continues to point to a bearish market structure with volume decreasing. Relative Strength Indicator (RSI) The RSI indicator is one of the most popular and widely used technical analysis indicators. The indicator focuses on whether the coin has been overbought (during bull markets) or whether the coin has been oversold (during bear markets). Therefore, if the RSI rises above 70, the coin is overbought, and if it breaks below 30, it is oversold.
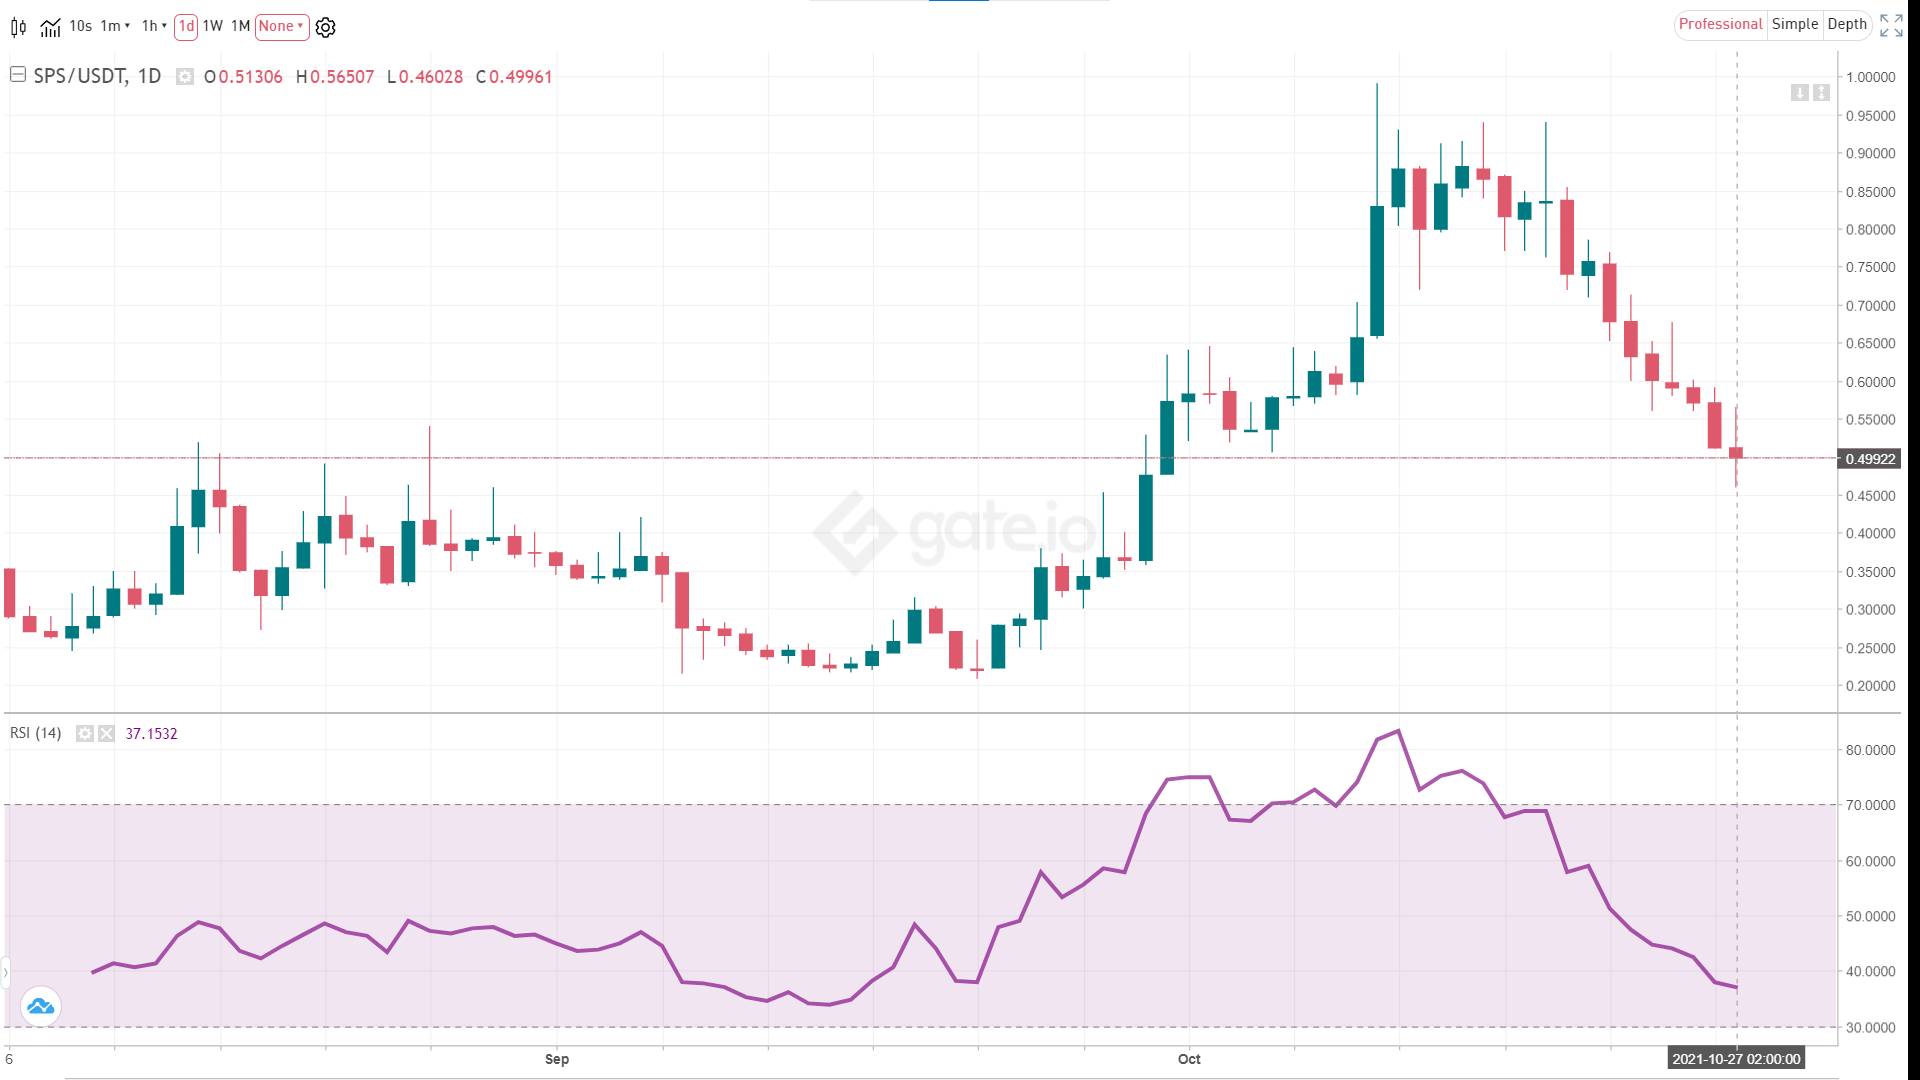
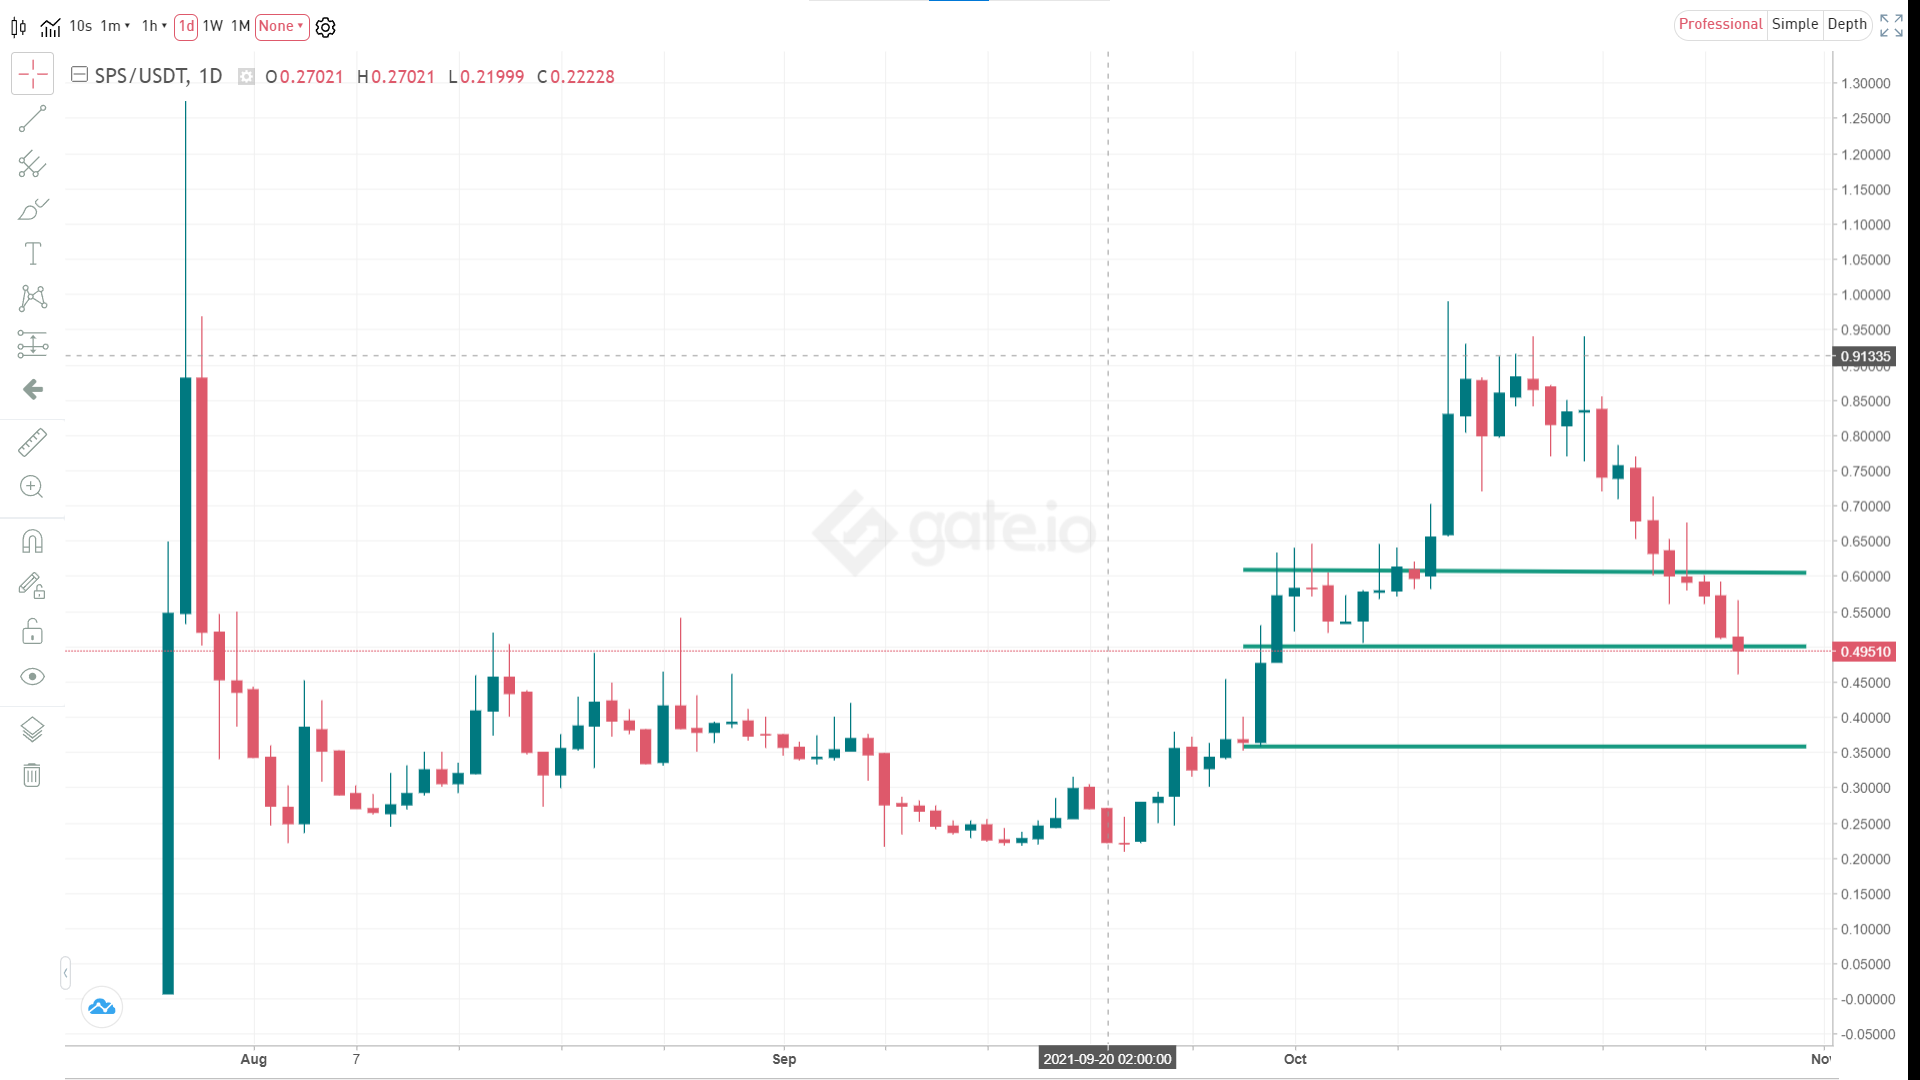
The $SPS token reached an RSI high of 83 on 11th October, and since then its been on a downward trend with the current RSI figure at 36. With the downward pressure on the price and people selling, I will not be surprised to see RSI break below 30 over the next couple of weeks. Where to next? All three indicators point to a bearish trend on the $SPS token, reflected in the selling price action over the past two weeks. In the previous post, I indicated that if $SPS couldn't maintain its momentum, the following support range for the token was between $0.6 and $0.65. This support range didn't hold very long, and the price is currently testing the support zone at $0.5. If this price can be maintained and trade sideways for a period, it would establish a good support range. If not, I can see the price breaking further to the following support range, which is $0.35.
What about fundamentals? It's essential to understand the fundamentals around the token and determine what other factors could be driving the buying or selling pressure on a token. The splinterlands team recently made changes to the DEC rewards, which significantly impacts new players to splinterlands. It's fair to say that the reception was mixed and may be contributing to the selling pressure. Secondly, the Chaos Legion pre-sale is underway, which saw the price of the $voucher reach levels way beyond many people's expectations. I even did a quick back of the napkin calculation of whether to sell the $voucher tokens I received as they would fund my Chaos Legion packs purchases once the pre-sale window is over. I think due to the high prices of $SPS and $voucher, it's an excellent opportunity for longer-term players to take some profit and pull out their initial equity in the game. https://leofinance.io/@mercurial9/chaos-legion-vouchers-to-sell-or-not-to-sell-or-splinterlands-128 Conclusion This was a longer post than I intended, and while most indicators point to a bearish market structure, I think we are in that lull zone before the Chaos Legion packs are unleashed on the world.

Are you new to splinterlands and want to learn to play the game? Check out my Ultimate Guide to Splinterlands: A Collection of Articles and Guides 2021. If you enjoy reading my splinterlands content, please follow and support me by signing up to playing splinterlands through my affiliate link: https://splinterlands.com?ref=mercurial9. We both would have a chance to receive a cool NFT! https://splinterlands.com/?ref=mercurial9 https://www.splintertalk.io/hive-13323/@mercurial9/ultimate-guide-to-splinterlands-a-collection-of-articles-and-guides-2021-or-splinterlands-100 Thank you for reading, and I hope you have a good rest of the day! Follow me on these other platforms where I also post my content: Publish0x || Hive || Steem || Read.Cash || Noise.Cash || Twitter https://www.publish0x.com/@aftershock9?a=Vyb82ANmev https://hive.blog/@mercurial9 https://steempeak.com/@mercurial9 https://read.cash/@merurial9 https://noise.cash/u/mercurial9 https://twitter.com/minimalistpixel
No comments yet