Decoding Triangle Formations in Trading
Triangle formations are tools for traders to provide insights and indications of potential market shifts. In the world of crypto and TradFi price charts, triangles may capture the decrease in price volatility that typically precedes movements.
When traders identify a type of triangle formation they gain access to high probability trading opportunities especially when technical indicators align with prevailing market sentiment. All types of triangles showcase real-time action by highlighting decreasing price volatility.
While primarily serving as continuation patterns triangles can also signal reversals depending on their type and occurrence within an uptrend or downtrend. Traders need to be familiar with the three core types of triangles; Ascending Triangle, Descending Triangle, and Symmetrical Triangle.
Ascending Triangle
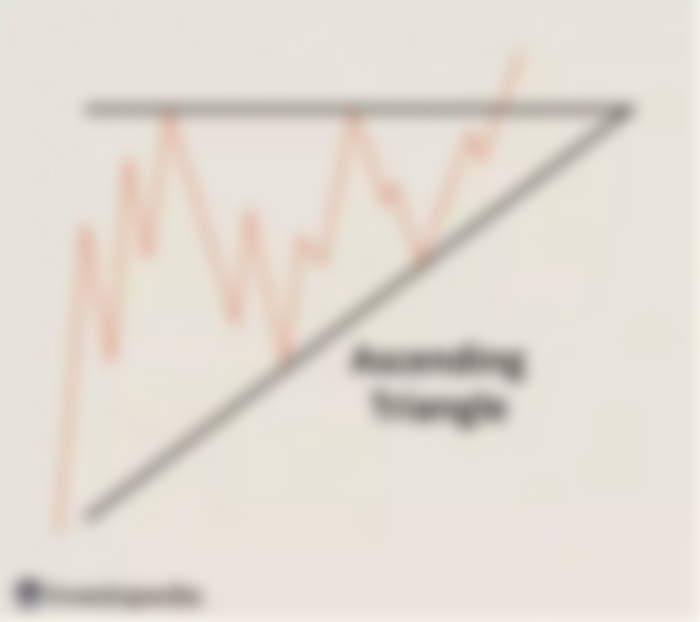
Source: The Ascending Triangle Pattern: What It Is, How To Trade It
This bullish signal brings excitement to traders as it signifies a trend. An ascending triangle is characterized by a sloping trendline acting as support, at the boundary. The upper boundary is typically horizontal. Serves as resistance. The psychology, behind it becomes apparent when the price of the security (crypto or stock) approaches a resistance level, which attracts sellers who push the prices down.
On the hand when prices retreat optimistic buyers step in. Pushing them higher than the previous low point creates an upward slope in the triangle formation. Breakouts typically occur around the two-thirds of the triangle starting from its base up to the apex. An ascending triangle within an uptrend indicates a continuation pattern while in a downtrend it suggests a reversal.
Descending Triangle
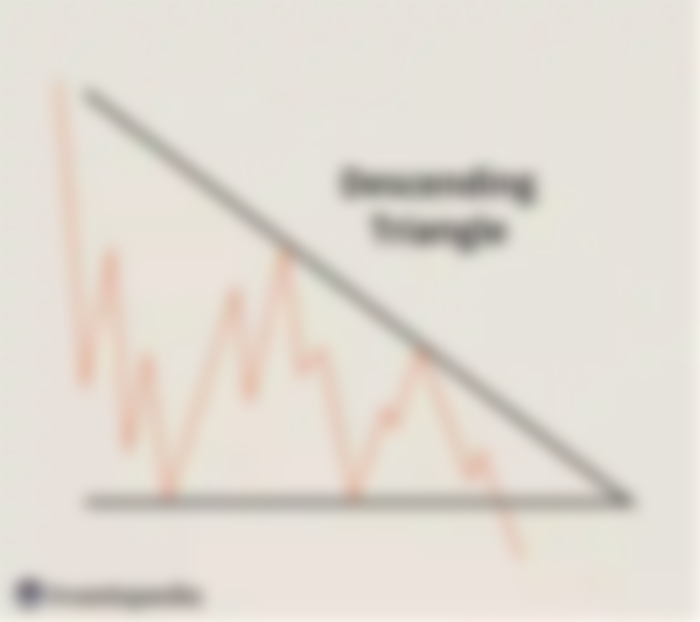

Source: Descending Triangle: What It Is, What It Indicates, Examples
On the contrary, a descending triangle represents a sentiment that may indicate both continuation and reversal patterns. It has a boundary that acts as support and connects at least two price points. The upper boundary is formed by a sloping trendline connecting price highs. This triangle exhibits behavior compared to an ascending one.
Symmetrical Triangle
Source: What Is a Symmetrical Triangle Pattern? Definition and Trading
The symmetrical triangle is suitable for trading and you may enter the trade when the security price breaks below the boundary of the pattern. This pattern forms when two boundary lines come together at a point with one line moving and the other moving downward. It is called "symmetrical" because both lines have slopes that match closely.
Understanding these triangle patterns is important for traders who want to understand more about the market. Whether it is recognizing signals or bullish or bearish indicators, understanding these formations helps traders interpret and anticipate price volatility movements effectively.
Thank you for reading and hope you have a good rest of the day!
Follow me on these other platforms where I also post my content: Publish0x || Hive || Read.Cash || Noise.App || Twitter|| Torum