In one of my previous articles I have discussed what I learned about candlestick charts. If you are a newbie like me in trading you may also want to take a look at this article : Blow the Candle: Understanding the Candlestick Chart to have an idea on what a candlestick chart is. It is alright if you are new to the world of cryptocurrency because I guarantee that you will somehow understand what I was saying because I am new to it myself. I tried my best to explain to myself what I have read and hopefully you can pick something up too.
After learning what a candlestick chart does and displays, I found myself always looking at them in different intervals and in a different light. The more I stare at them and the more I pretend to comprehend what on fresh hell was going on the more I see that patterns seemed to emerge and present themselves. I took a look around and true enough there are patterns that some traders watch out for when looking at candlestick charts to guide their trading decision.
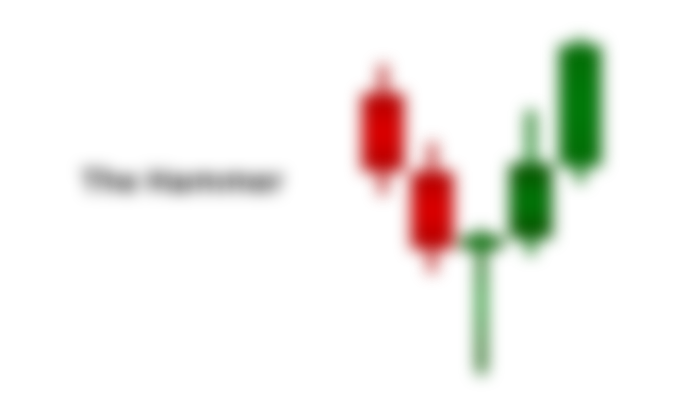
The Hammer
The hammer is formed with one candlestick on the chart. The body of the candle is usually short, the lower wick of it is at least twice as long as its body and it has usually have a little to no upper wick. Hence, it literally looks like a hammer.

What Does it Mean?
The hammer pattern on a candlestick chart means that after the asset was opened for trading, sellers drove down the price of the asset by selling significant amount of the asset at a lower price, indicated in the long lower wick, but towards the end of the trading time frame, the traders rallied to buy significant amount of the asset causing the price of the asset to go up and higher than it's opening price, thus forming the short body of the candle.
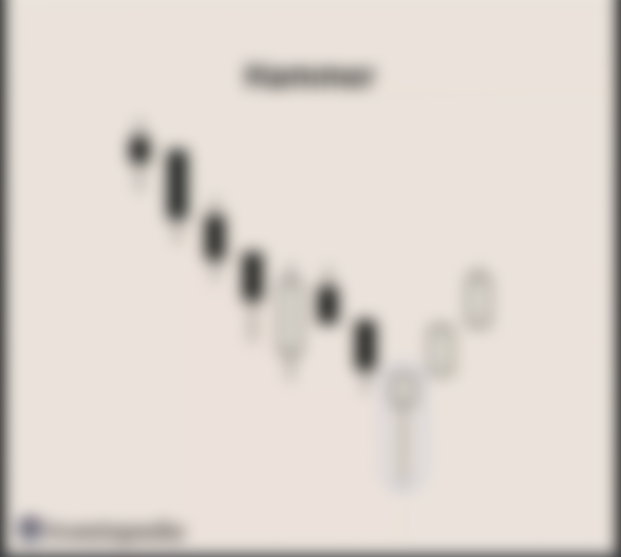
If the hammer presented itself during a downtrend (bearish run, dip) they say that it can be hinting that the dip is reaching its bottom. Potentially this means that a price reversal is coming, in simpler words, the price of the asset is going to increase again. And to translate it to money talk, the asset you are holding are going to increase in value, if you are looking to make some quick cash you may buy more of the asset and sell them when the price is higher.
However, I want to emphasize that they said "potentially". Seeing a hammer pattern on the candlestick chart does not automatically equals to price reversal or a bullish run. Some traders wait for the next candle to confirm if it really is a bullish hammer.
Since hammers are expected to appear at the bottom of the downtrend, the preceding candles or the candles that came before the hammer must be bearish or red candles. If the candle following the hammer is bullish or green and the closing of that candle is higher than the closing of the supposed hammer then the hammer is considered "confirm" and it strongly suggests that a price reversal has been initiated.
According to investopedia, when the hammer is confirmed traders would either short sell or enter long positions. I read about this two concepts but I would expound and explain them at a later date maybe.
Bullish Hammer in the Wild
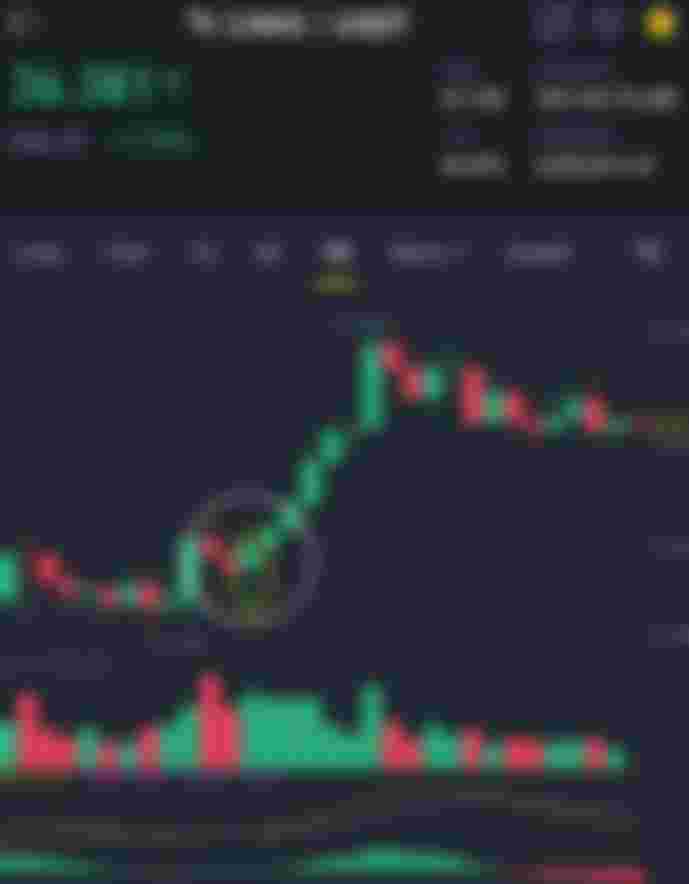

Looking at the image above doesn't the candle encircled in yellow resembles a hammer? Short body, long lower wick and just a little bit of upper wick. It's a hammer right? And zooming out a bit, the hammer seemed to be confirmed because it followed 2 red candles and it was then followed by several green candles.
With this example it seemed to substantiate and make a strong case for the plausibility of the theory of the hammer. I imagined that some of the experienced traders made some money with that trend.
Inverted Hammer
And inverted hammer is just like the hammer in essence but the only difference in their visual representation is that the inverted hammer has a longer upper wick and a little or no lower wick.


The inverted hammer that appears also on the bottom of the downtrend may represent a price reversal or the start of a bullish run just like the hammer. After opening of the trade buyers rallied to buy significant volume of the asset but the sellers tried to drive down its price. However, the sellers did not totally succeed since the closing price was still considerably higher than its opening price.
Conclusion
Since the trading for cryptocurrency is 24/7, there really is no real opening and closing of the trade time. That being said, this pattern may appear in different intervals, 1 minute, 5 minute and so on. In theory, I believe that trading in the shortest timeframe you can concentrate on is still the best because the market can change in a single moment. But if you are in it for the long term, you can still plan accordingly and play the long waiting game.
Bear in mind that patterns such as this one, though accurate, may not mean 100% certainty. As volatile as the crypto market is, it is considerably unpredictable and may not conform to any trend or pattern. This is just a guide and not definite instructions. Think of it as fortune-telling, it's fun and interesting to know but you should not bet your life in it.


Hey there!
Thank you for reading this one with me. I really find it helpful to write while I learn. It feels like taking down notes while you are in a lecture. So, if you like you can learn with me and let's exchange notes. :)
As always,
Cheers!!!
Sources :
https://blog.quadency.com/how-to-read-candlestick-charts-patterns-crypto/
https://www.investopedia.com/terms/h/hammer.asp
https://corporatefinanceinstitute.com/resources/knowledge/trading-investing/hammer-candlestick/
https://en.wikipedia.org/wiki/Hammer_(candlestick_pattern)
Lead image : https://medium.com/theheartilab/surety-ai-the-insurers-mj%C3%B6lnir-222b5740f936
New knowledge. Thanks a lot. Now, I am never looking at hammers the same way again. Haha. Anyway, you are right, market really changes every moment.