“The essence of the independent mind lies not in what it thinks, but in how it thinks.”
-Christopher Hitchens


Since bottoming around $8,200, Bitcoin has led the market on a stampede posting a 15% on the weekly charts and 3% above the previous local high. However, mixed signals can be found on stronger time frames when taking a look an several indicators/oscillators. Many lean bullish, but some are potentially showing signs of exhaustion, provoking uncertainty for a small amount of investors-including myself and having a similar feeling like an uninvited guest at the fiestas of San Fermin.


So what do you think? Are you dashing to fill out as many credit card applications as you can? Or are you apprehensive to dig the astronaut helmet out of the closet just yet? For those in doubt or for those who can’t understand it, here’s the case for the contrarian:
Indicators:


Hey hey hey
Looking at Bitcoin, several reliable indicators scream: RALLY! But what happens when the minute Bitcoin starts a rally, arguably the most defining indicator is already maxed out?


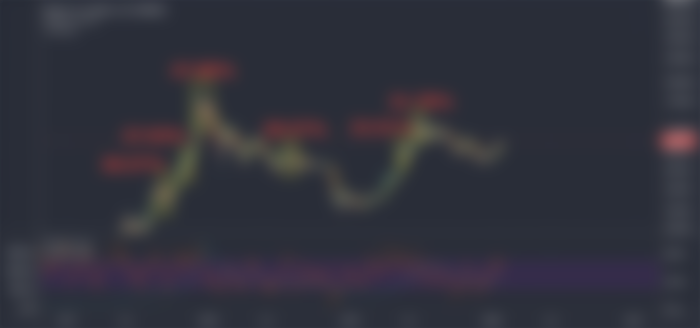
Weekly MACD crossover
Bullish MACD cross:
The MACD is traditionally one of the most reliable indicators for Bitcoin traders especially on strong time frames in determining the macro trend. Currently observing Bitcoin, you’ll see a Bullish Crossover happening on both the weekly and daily charts-indicating a strong macro rally. Past performance is not a reliable indicator for future results but, one of the most defining moments for the bull run in 2017 was a bullish MACD crossover at the end of 2016.
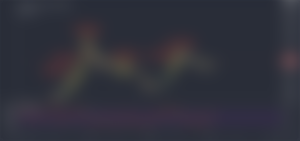
Daily 20 EMA(Yellow) and 200 EMA(Blue)

Daily 50 EMA(Yellow) and 200 EMA(Blue)
EMA:
Out of the basket of what seems to be an infinate amount of Moving Average variation, I’ve found the exponential moving average to be the most consistant on stronger time frames. Right now, 2 important observations can be drawn from it:
1. We are currently trading on top of the 20 EMA and the 200 EMA: Both are benchmark indicators for determining the macro trend in both traditional markets and for Bitcoin historically.
2. Upcoming potential golden cross to form between the 50 EMA and 200 EMA.

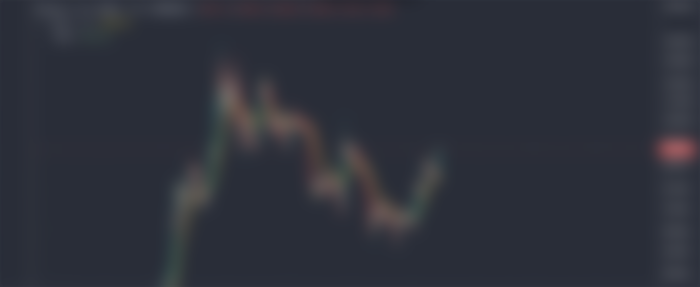
Daily 3 White Soldiers
3 white soldiers:
If you’re a pattern trader, on the daily you’ll immediately notice 3 beautiful candles known as the 3 white soldiers. Three white soldiers is a bullish candlestick pattern that is used to predict the reversal of the current downtrend in a pricing chart. The pattern consists of three consecutive long-bodied candlesticks that open within the previous candle's real body and a close that exceeds the previous candle's high. These candlesticks should not have very long shadows and ideally open within the real body of the preceding candle in the pattern. However, this particular pattern carries a little weight of ambiguity on it, so it’s best to take it into consideration with other reliable indicators.
Now I know what you’re thinking: Good god man I get it I’m convinced we are MOONING!!! But slow your roll there and hear me out because this may not be the best time to risk your credit score on future dreams of yachts and lambos-YET. Take a step back and look at what’s unfolding with arguably one of the most important indicators for any market out there to trade. The RSI looks like it’s ready to fall off a cliff. Aside from that, a much less popular yet still reliable indicator, Willy divergence is reaching stupid. There’s potential Bearish divergence on the histogram. We have an increasing number of buyers with decreasing sizes of orders resulting in falling buyer volume. On top of all that, What’s the best way to really destroy an army of dreaming traders? Run the price up making all the stars align perfectly, almost too perfect, and immediately turn all those positions into the Pacific Ocean-64 million square miles of water folks that’s a lot of liquid. That’s right, we are in the kill zone.
RSI:
The RSI is on the cusp of overbought sitting at 71. When considering the trend, I’ve found the RSI to be the most reliable indicator used on the daily charts to help determine the potential path Bitcoin is going to make. Historically Bitcoin has always been extremely shaky when the RSI crosses into overbought territory. Don’t believe me?
Historical performace regarding the Relative Strength Index
Almost every time Bitcoin reaches overbought on the daily, we see disastrous price action. Before you say: “But in 2017 we were overbought for weeks so you’re an idiot” there’s a reason I underlined WHEN CONSIDERING THE TREND. In 2017, we were on the last leg of a two year bull run. Entering 2020, look at this horrific trend that 2019 left us:

This is heinous loss right here, this is the perfect example to show someone what NOT to buy.
However, RSI is an oscillator so all hope is not lost. The reason being is that Oscillators can be reset with a balanced shift in momentum meaning that if we trade sideways for a few days or a few weeks, then Bitcoin doesn’t even need to drop much in order to bring the RSI back to a neutral 50.
Price:
Now my disciples, don’t go running off just yet thinking I just crushed your dreams using technical indicators as the hammer, indicators aren’t the only thing you should be paying attention to. Let’s take a look at the simplest thing to observe: the price.


Inverse Head and Shoulders
While it’s imperative for the bulls to not allow price action to slip back to the power of the Bears, a sustainable pullback may not only be a necessary break to reset the oscillators, but a pullback to $7,800 could form one of the most bullish patterns of all: An inverse head and shoulders. Now that we’ve gotten the attention of all the hopeful crypto investors who had almost forgotten memories of the moon, this could be the one thing to facilitate the biggest bull run you’ll ever see in your life.
Destination: Moon?
So it won’t be an easy or a short road to the top, but it should be an interesting journey. Starting with our first milestone closing a weekly candle above $10k followed by a necessary break of the $14k resistance that crushed our dreams last summer. The most important thing is to not invest on your emotions and making a bad trade(unless you're a HODLer). Bitcoin isn't going anywhere anytime soon so the most important thing is to protect your capital because the only way you will miss out on a trade is if you lost it all on impulse. But if all goes well, we should start seeing growing price action in the not too distant future.


With a stock market pullback looming, it’s time to begin strategizing ways to hedge your investments to protect your capital. That’s why I’m excited to announce being a part of a brand new platform called Traderlist, specializing in: Decentralized Digital assets, Indices, and other Store of Values. Traderlist is an investing experience created to bridge the knowledge-gap between the average investor and professional investors. Our goal is to provide everyone with access to well sourced information on investments – not just the wealthy.Traderlist makes investing in financial markets more intuitive, and more fun, no matter how much experience you have (or don’t have).
For as little as $10/month you can get exclusive access to me, my strategies, and my game plan to undoubtedly CRUSH these markets using my tool set both born in and proven to grow equity even in a bear market. So don’t view this as just another subscription, see this as the benchmark for your independence and the beginning of a relationship with someone who you can trust to teach you methods that can consistently make you money.


*The information presented above is intended as an opinion and should not be considered as financial advice*
I’m an Eliottwave Trader who primarily trades Cryptocurrencies, Forex, and Indices. This analysis is reposted from my Tradingview account where I post daily and try my best to keep the page up to date with all of my trades with high potential of profitability.
https://www.tradingview.com/u/mduchow/
If you’d like to support me or my content, here’s how:
https://www.tradingview.com/gopro/?share_your_love=mduchow
BTC: 1Ertf1kkp6n21BceXUnC5Rnb4H1FUBRUev
ETH: 0x05f1B737CDC06D1288a92413865Ec2B6A4766239
LTC: LSFYic3Rn4qFTRkFyC1QQqRoZheUeynik2
XRP: rH5zVnjTkG68dscx6KTSQbupZtL6xYKg48
Thank you so much for viewing my content, follow my tradingview for more frequent updates on the market.
Follow my moves to undoubtedly CRUSH this market and turn yourself from AVERAGE JOE into SAVAGE JOE.
Thank you for this exellent analysis.
My gut-feeling tells me the bulls are exhausted and need a breather. Maybe a pull-back to 7800 to form that inverse head-and-shoulders is a good idea. Seems they've been trying themselves to do the "over9000"-meme and stay there. Maybe that's too ambitious of a goal at this point. Anyway, I think time is on the bulls side so they can take it slow and catch a deep breath before what's possibly to come. Patience, my friends. Good things come to those who wait.
an one terminology question: what's a "stronger" timefrime? A longer one?