Bitcoin price is slowly rising and it is trading above the $34,000 and $35,000 resistance levels against the US Dollar.
The price is now just above the $36,000 level and well above the 55 simple moving average (4-hours).
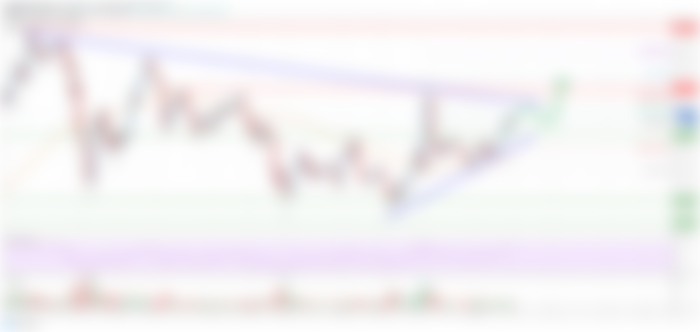
There is a key bearish trend line forming with resistance near $37,000 on the 4-hours chart of the BTC/USD pair (data feed from Coinbase).
The pair is likely to surge above $37,000 as long as there is no break below the $34,650 support.
Bitcoin price is showing a few bullish signs above $35,000 against the US Dollar. BTC is likely eyeing a crucial upside break above the $37,000 resistance level in the near term.
Bitcoin Price Analysis
In the past few days, there was a decent increase in bitcoin price from the $30,000 support zone against the US Dollar. BTC broke the $32,000 and $33,000 resistance levels to move into a positive zone.
The recent swing low was formed near $32,191 before the price climbed above the $35,000 resistance. The price traded above the 50% Fib retracement level of the downward move from the $38,703 swing high to $32,191 swing low.
It is now just above the $36,000 level and well above the 55 simple moving average (4-hours). The first major resistance is near the $36,200 level. It is close to the 61.8% Fib retracement level of the downward move from the $38,703 swing high to $32,191 swing low.
The main resistance is near the $37,000 level. There is also a key bearish trend line forming with resistance near $37,000 on the 4-hours chart of the BTC/USD pair.
If there is a clear upside break above the trend line resistance, the price could rise above the $37,800 and $38,000 resistance levels. The next key resistance is near the $38,700 level. On the downside, there is a major support forming near the $34,800 level.
There is also a connecting bullish trend line forming with support near $34,700 zone on the same chart. If there is a downside break below the trend line support, the price could slide towards the $32,200 support zone.
Bitcoin Price

Looking at the chart, bitcoin price is clearly trading well above $35,000 and the 55 simple moving average (4-hours). Overall, the price is likely to surge above $37,000 as long as there is no break below the $34,650 support.
Technical indicators
4 hours MACD – The MACD is now gaining momentum in the bullish zone.
4 hours RSI (Relative Strength Index) – The RSI is now above the 50 level.
Key Support Levels – $34,700 and $32,200.
Key Resistance Levels – $37,000, $37,800 and $38,000.