Bitcoin and Dominance Chart Review July 13th 2020 ?
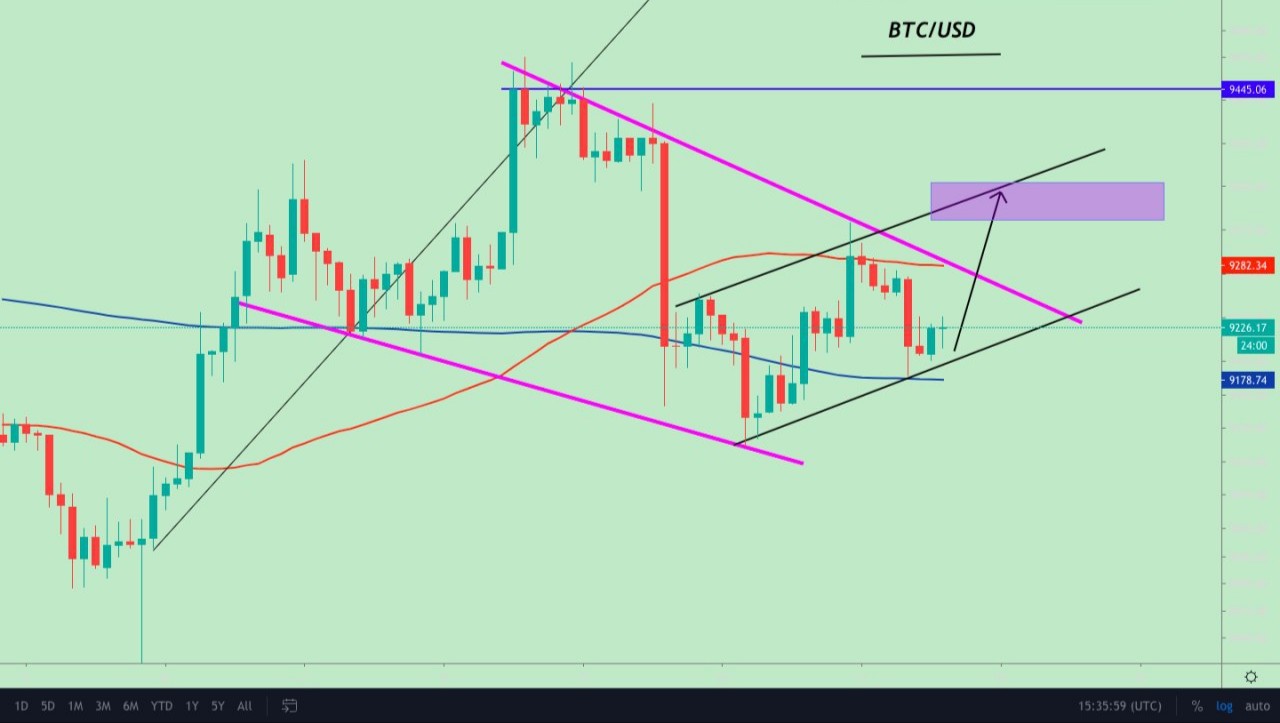
#BTC/USD Update: BTC bounced from the 200D MA (Blue Line). And the current resistance happens to be the 50D MA which also coincides with the purple resistance line. If this resistance breaks which is highly likely The price could reach 9400 within the next 2 days.
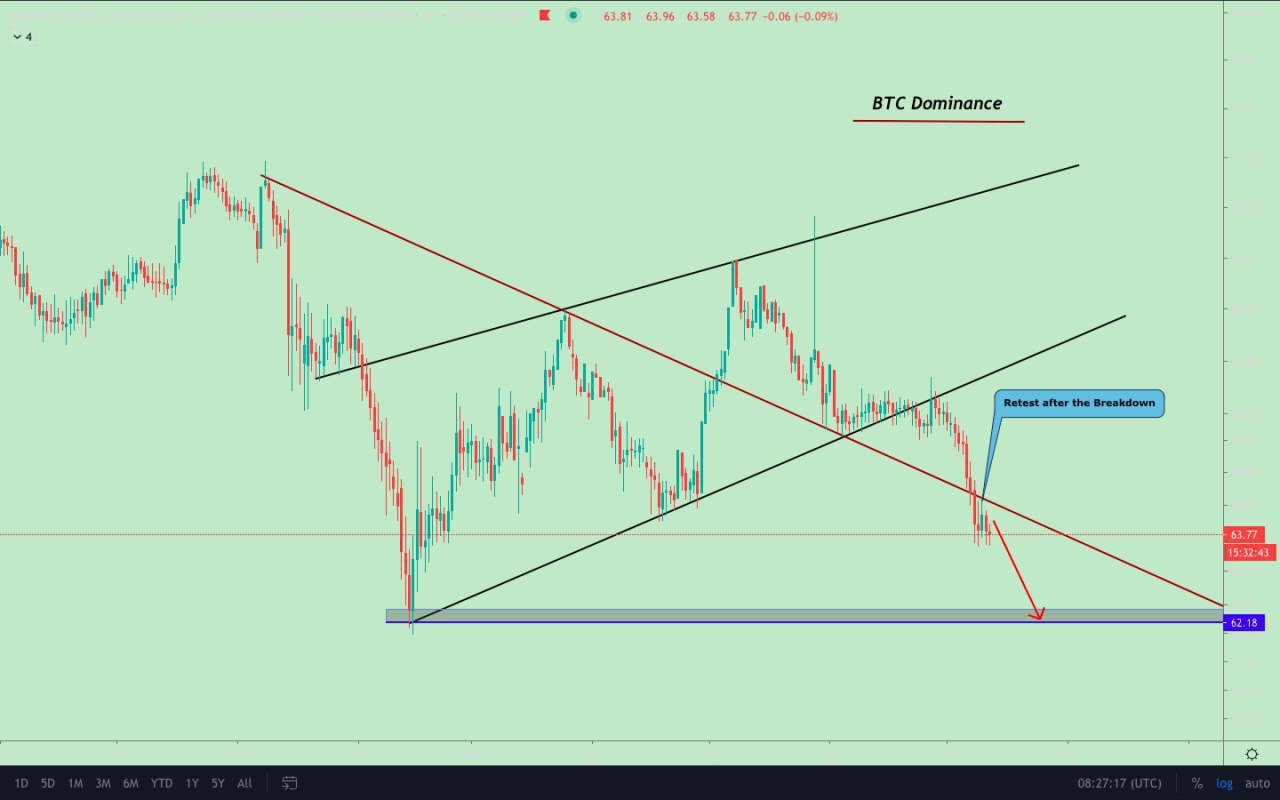
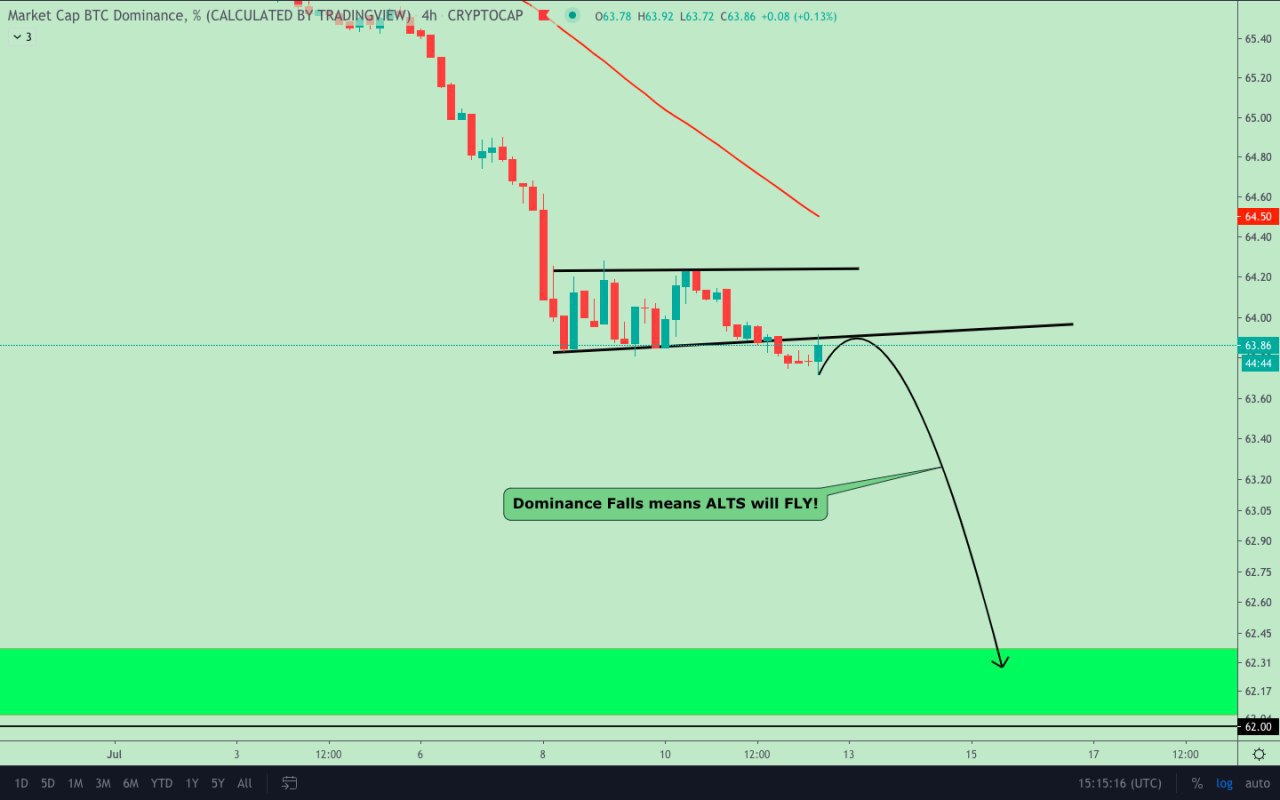
#BTC_DOMINANCE Update: Dominance broke below the support and there’s still a lot of Room for it to fall to the 62 Level. This fall will provide a lot of room for the alts to grow too.
This is what I meant. It broke down formed a bearish Pennant.
Broke below the pennant too and retested. What do you expect now?
Of course Alts party will continue.
Cheers
Note :- its only for education purpose, This is not a investment advive.
Don't have a @Binance account yet? Open this #BinanceTurns3 gift and WIN up to $100 in FREE #BNB tokens! https://www.binance.com/en/activity/red_packets/19561892&RP1448898592247848158812
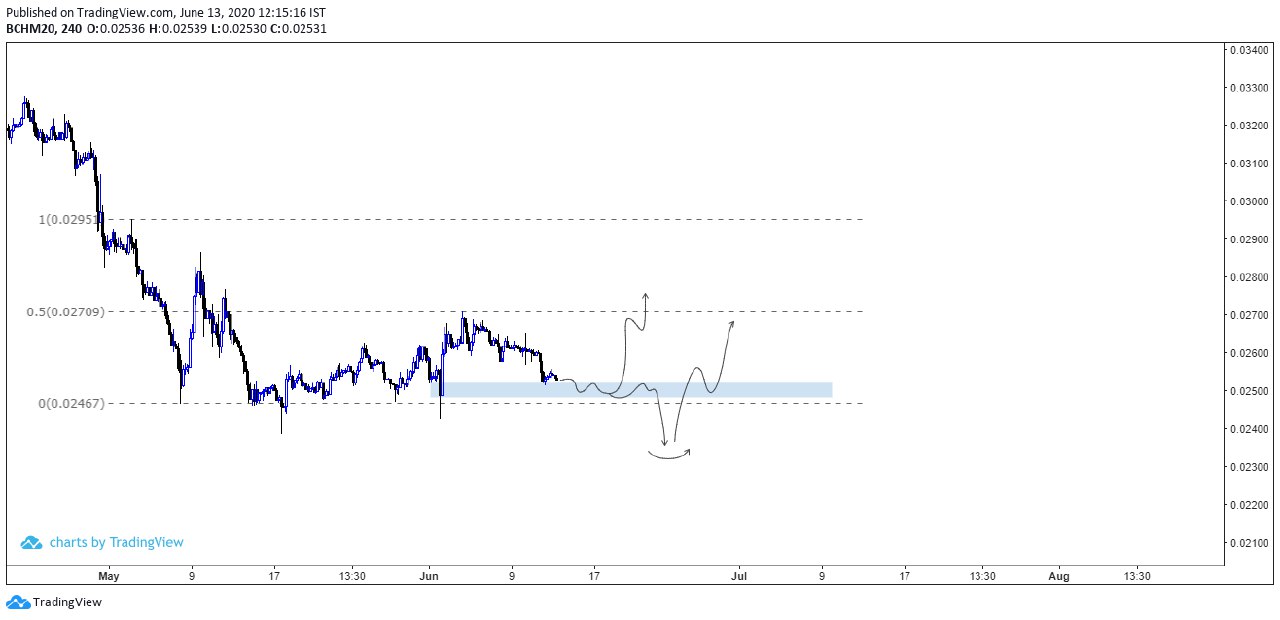
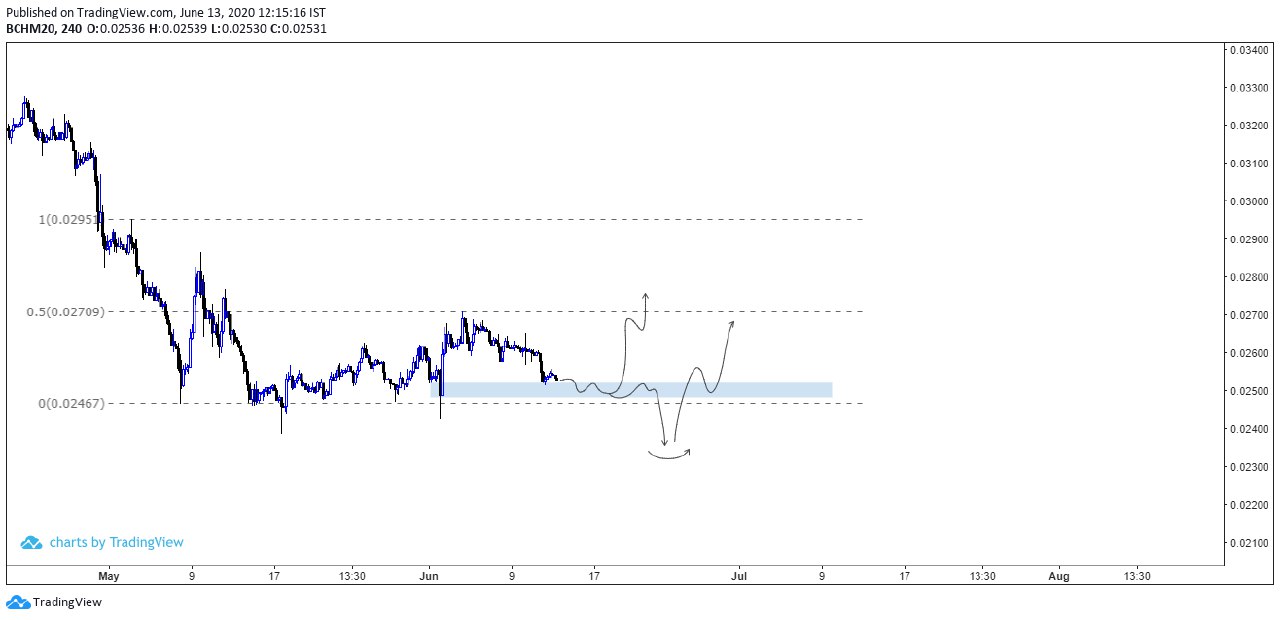
$BCH approaching H4 demand ?
https://www.tradingview.com/x/KPz4zXeA
$BCH approaching H4 demand. If there is too much congestion at this demand level. expect a sell side draw and close back above the blue. Pretty much all the majors are looking like this PA wise.
Bitcoin chart Review and Update #4 ?
**#BTC** **UPDATE**: BTC just broke the 9700 level touched 10k and then dumped back to the same level, Feels like a Sunday. https://peakd.com/trending/btc
Nevermind, What’s really important right now is whether alts are safe or not
Or are we heading for the 10k already?
We will wait for the daily close.
You can’t make a decision out of scammy BTC wicks.
We had seen these kind of moves before. Altcoins which are so down will be back up tomorrow.
BTC doesn’t just go to the moon. It needs time and new money must enter the crypto market.
If you sold your Altcoins, congratulations you just learned what not to do during these pumps.
**Coinbase Update ?**
Coinbase is exploring the addition of 18 new digital assets, some are live, some are not. We will evaluate each against our Digital Asset Framework. It’s our goal to offer support for all assets that meet our standards and are compliant with local law. https://twitter.com/coinbase/status/1270830655354671104 June 10, 2020 https://twitter.com/coinbase/status/1270830655354671104?ref_src=twsrc%5Etfw
Rumour about VET being short listed for Coinbase listing. This could be a huge news and it could possibly pump like OMG, Remember the OMG pump? It was because of the same reason. Coinbase Listing! Be ready!!
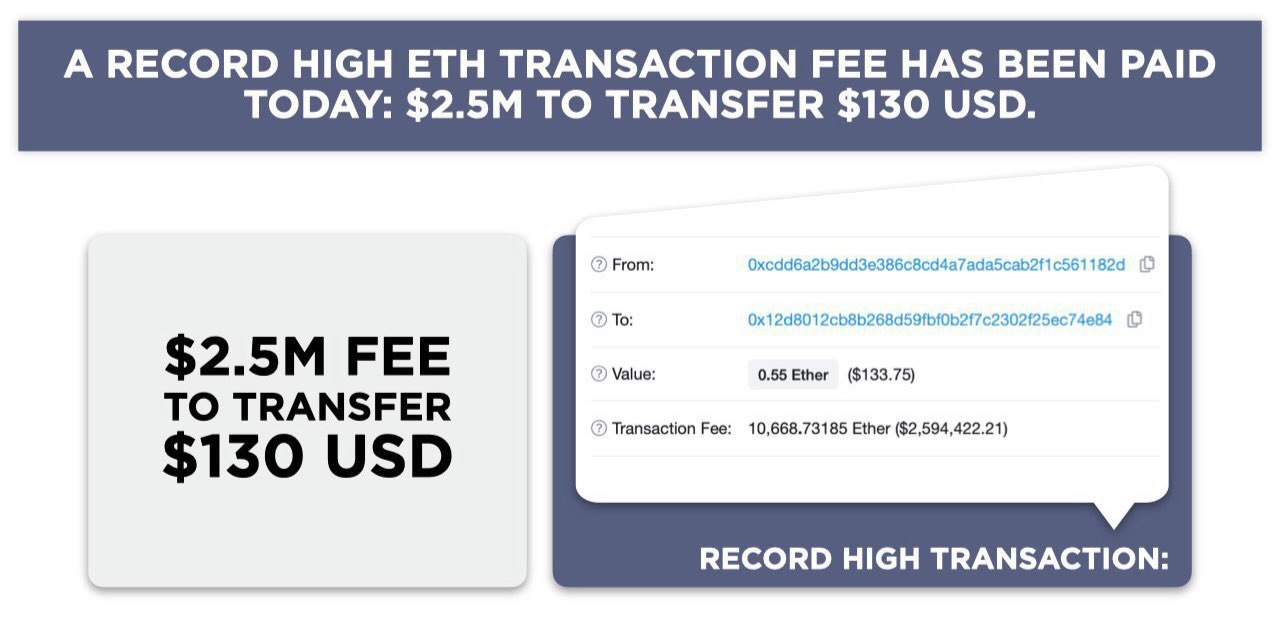
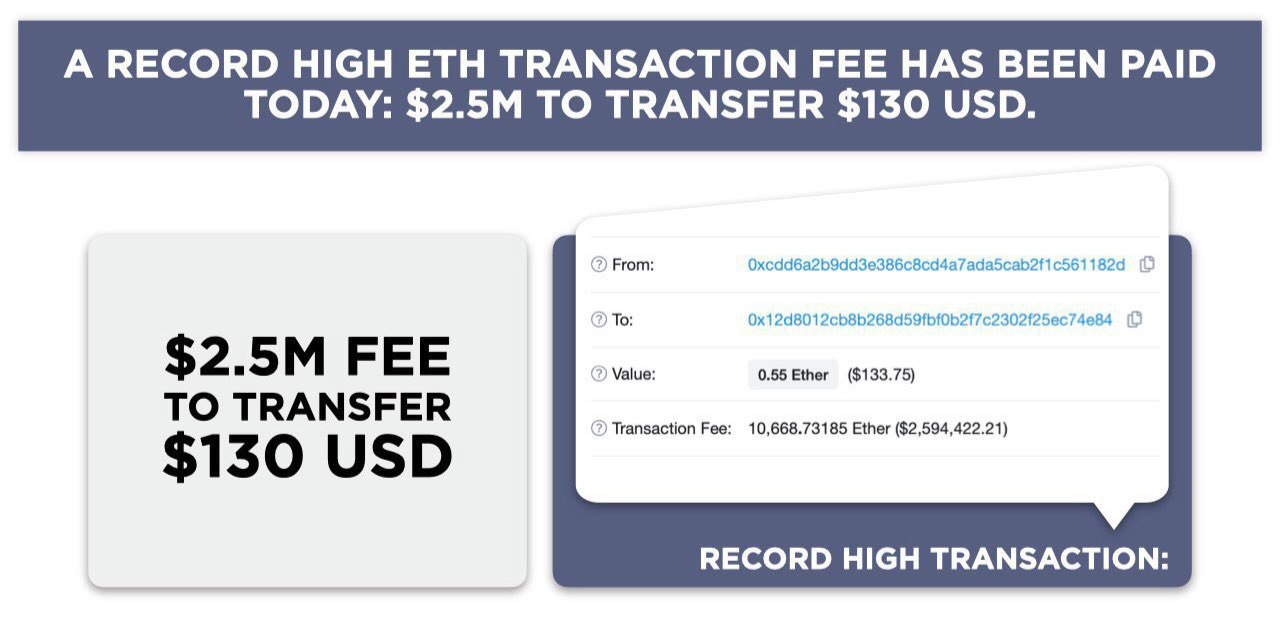
A Record High Transaction Fee Paid Today 2.5 million fee for just 0.55 Ethereum transfer ?
Ethereum 2.0 To Launch soon and Investors accumulates more ETH tokens soaring Network fee at its peak, A record high ETH transaction fee has been paid today $2.5M to transfer $130 USD.
https://etherscan.io/tx/0xca8f8c315c8b6c48cee0675677b786d1babe726773829a588efa500b71cbdb65
A user probably mixed up value to transfer and the fee, In 2019 another transaction worth 0.1 ETH with 2.1K ETH as transaction fee has been made.
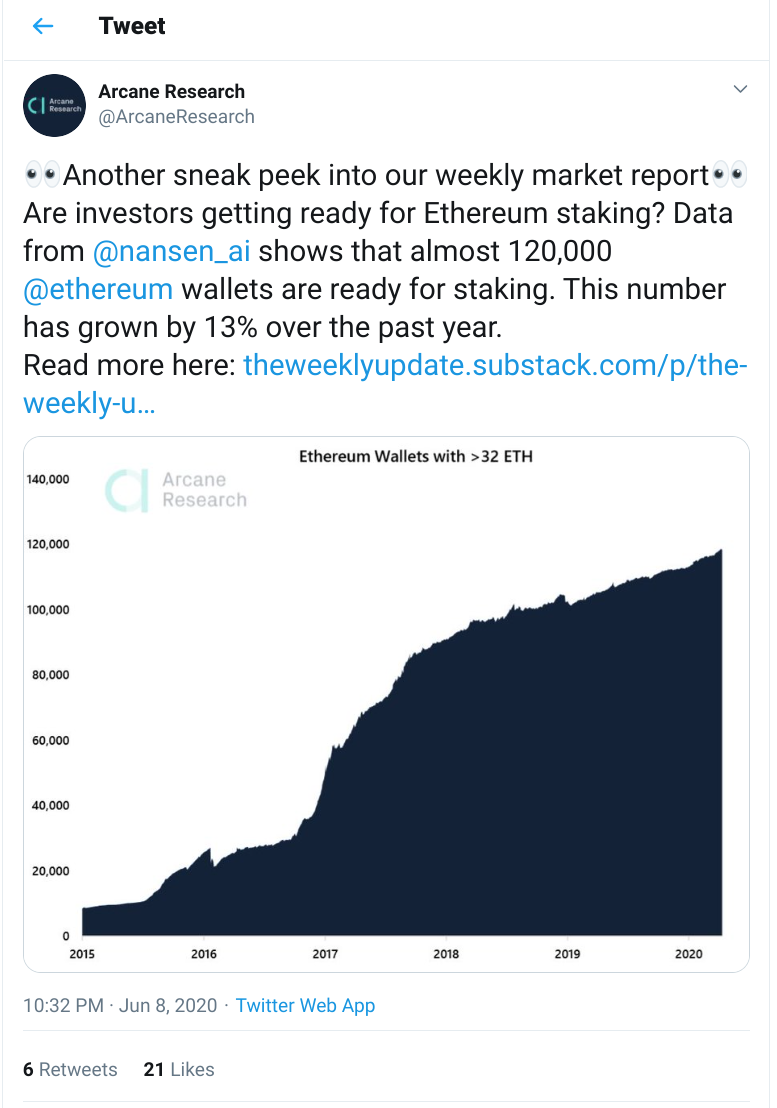
https://twitter.com/ArcaneResearch/status/1270000812341821442
#ETH holders are stacking more ETH every year! According to the arcane research it is found that the amount of wallets holding more than 32 ETH has grown upto 132,000 + in past 5 years, It shows how bullish ETH holders are on ETH, Let’s see how long it goes From here.
Btc update #3 ?
Btc still in no trade zone for us. We need to have clear breakout of 9840$ than next targets 10050$,10300$,10440$ in few days. Trend suggestions we already suggested you. If didn't breakout this level we might see 9460$,9100$ levels in coming days. For us it is still strong and possible 10000$+ again very soon. We will suggest you leverage entries after clear picture of it. Spot holding from 9340$ price.
Bitcoin Chart Review and Update #2 ?
Bitcoin chart review
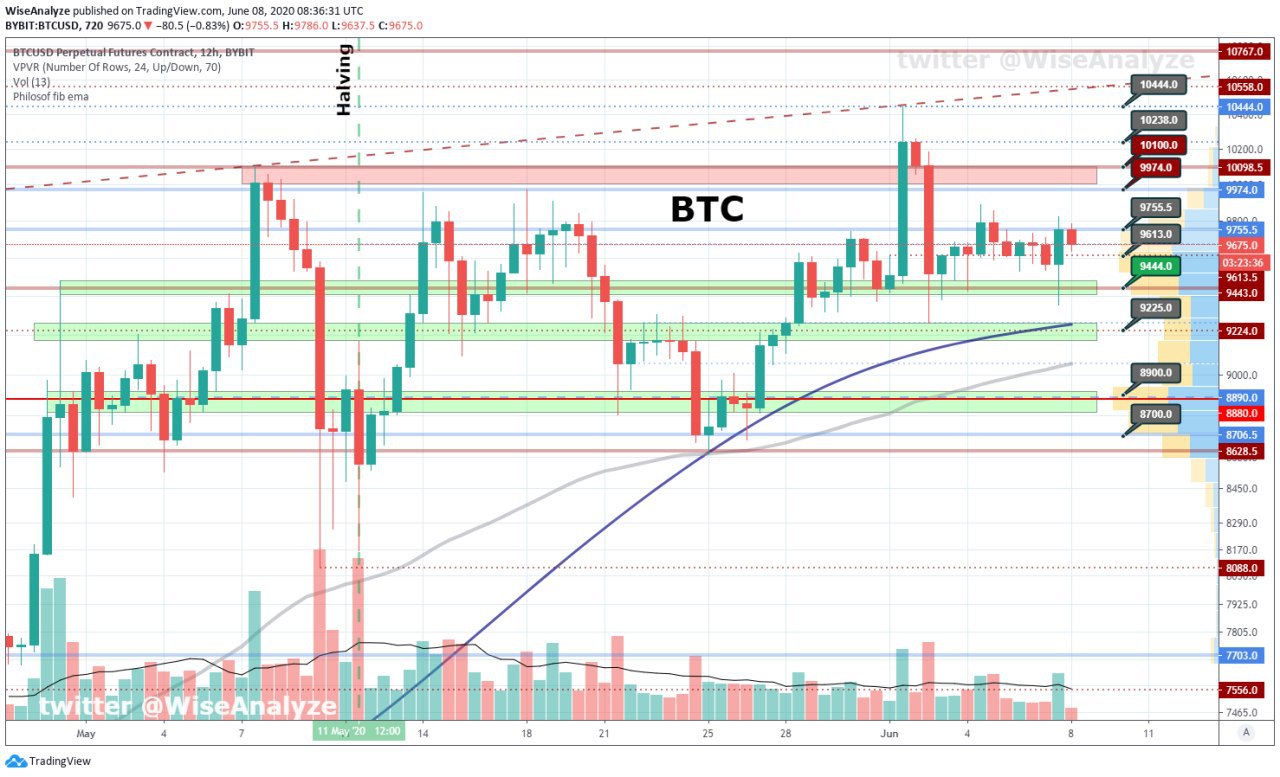
BTC CHART Published at WiseAnalyze #Tradingview
https://www.tradingview.com/u/WiseAnalyze/ https://steempeak.com/trending/tradingview
**Comment**: Bitcoin bounced from 9356. This is 12H chart for a change. Last candle look bullish and has increase in volume, which gives an idea, that those who bought the dips will hold till proper chance to take profit higher from current level. Therefore main targets are nearest resistance zones at 9975-10100.
P.S. This is still an uptrend, so don't play risky with shorts. Just buy the dips.
Resistance: 9755 - 9970 - 10100 - 10240 - 10444
Support: 9600 - 9444 - 9222 - 8900 - 8700
#BTC/USD Weekly TA: https://steempeak.com/trending/btc
BTC CHART Published by ProAnalysis at #Tradingview https://steempeak.com/trending/tradingview
Weekly closed as we expected just above $9700. We are having some fluctuations now. But did you see that trendline? we closed above the resistance so far. I think we are 40% bullish now. It will be confirmed as soon as we hit and close above 10500. We can see some retracement to the 9300 area (likely) but after that the price must continue to hit the 10000 level again!
Bitcoin Dominance Update:
Bitcoin dominance is forming a bear pennant pattern which can break to the downside.
For this to happen a lot of liquidity has to be transferred from BTC to Altcoins. It seems likely if BTC goes for a correction.
But holding the support level will cause in further correction in Alts and a massive rally in bitcoin.
We need to watch this very cautiously.
This is the most important chart to see among all those Altcoin and bitcoin charts.
Fear & Greed index: 53 (<= 54 <= 54 <= 53)
BTC Dominance: 64.7% (<= 64,7 <= 64.7 <= 64.9)
24h Volume: $89 billion (<= 69 <= 80 <= 93)
#BTC #Bitcoin (TradingView) https://steempeak.com/trending/btc https://steempeak.com/trending/bitcoin
Source
This is the third reason which is fundamental in nature. This is why I THINK WE CAN REVISIT 10k soon. Read the news. Big Investment funds like Grayscale have bought billions worth of BTC. Do you think they will be buying the tops? So think about it. https://cointelegraph.com/news/grayscale-is-buying-up-more-than-just-bitcoin
Note: This Is Not Financial Advice, Do Your Own Research💯 .
Bitcoin Chart Review Bullish or Bearish ?
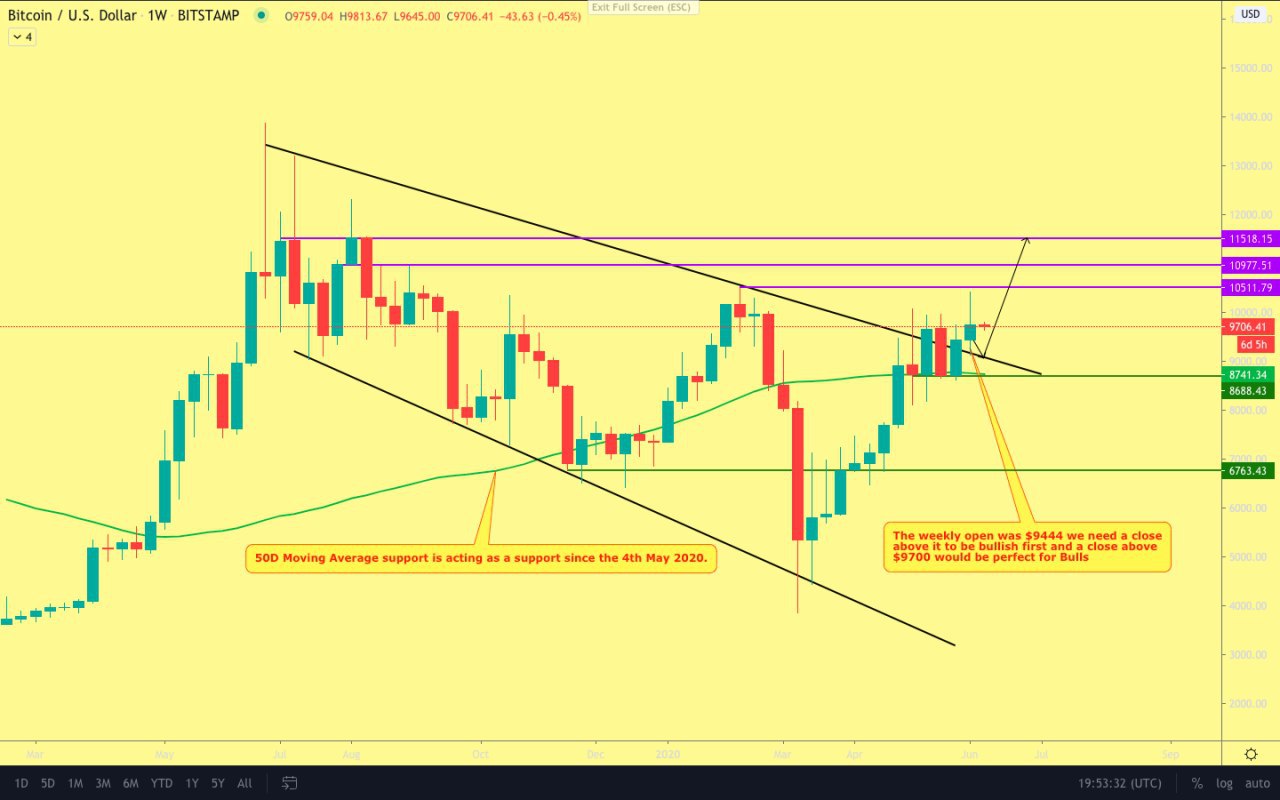
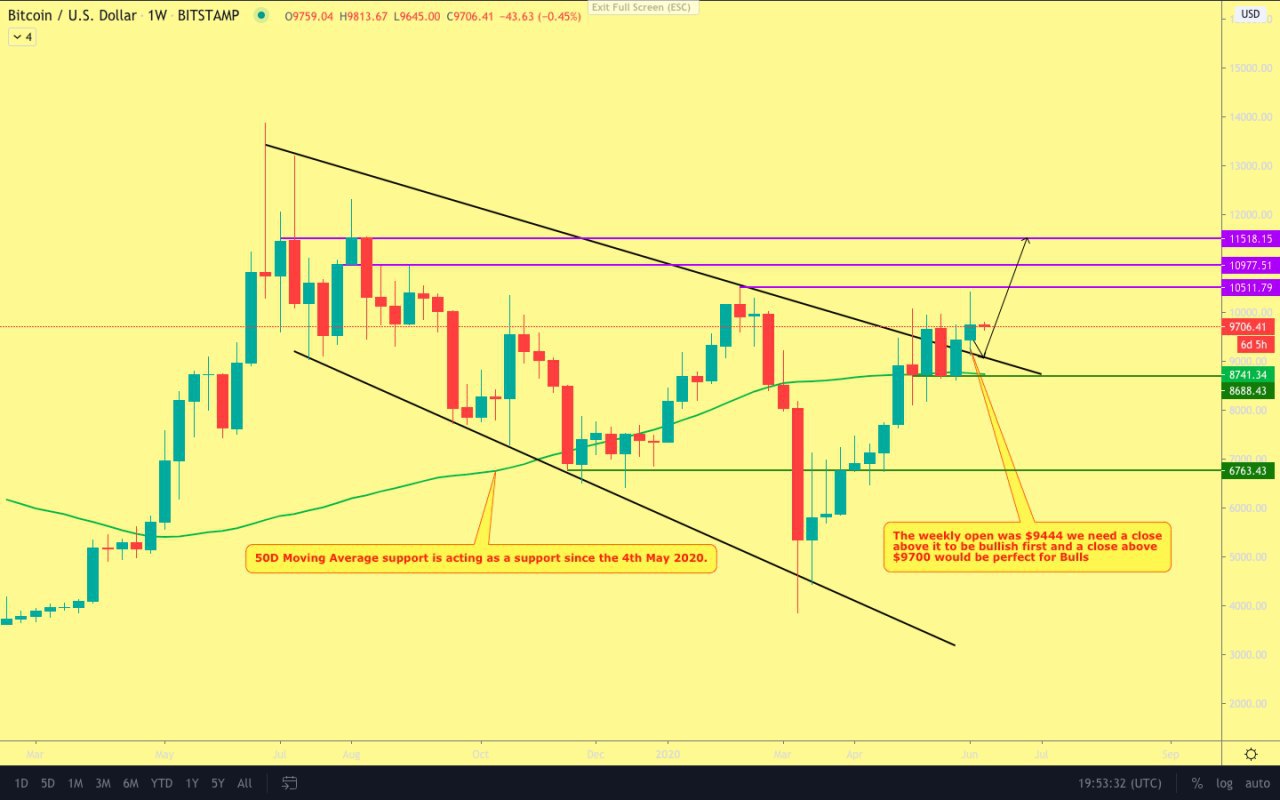
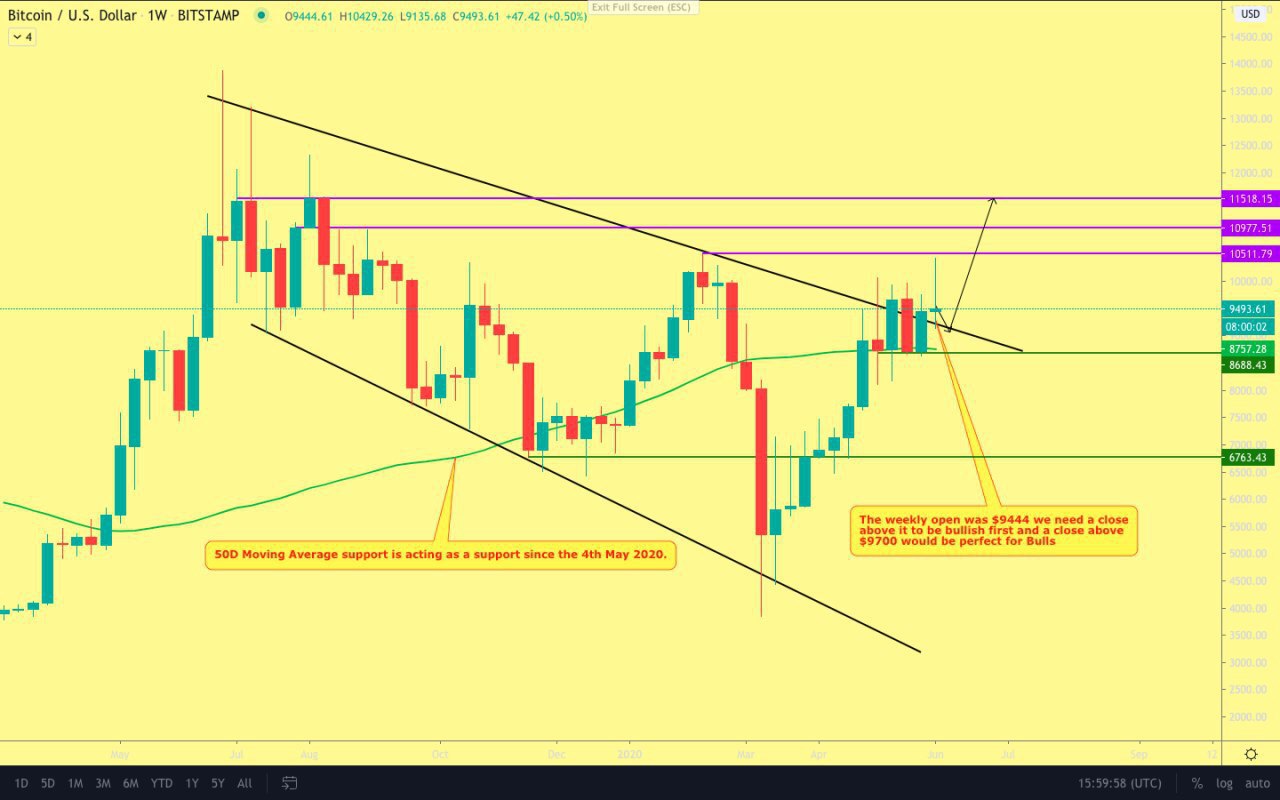
#BTC/USD 1 week Bullish or Bearish Technical Analysis:
A DOJI candle above above Resistance is very bullish sign.
All we need is a close above $9400 and then $9700 for being extremely bullish. Next 2 weeks will be crucial. We will see BTC heading to 10,000+ again (as per chart).
Why do I think BTC is bullish? These recent dumps could be a for liquidating the high leverage late longs on futures before heading to the upside.
Secondly BTC held the $9400 level which is a strong sign.
I will share the third reason after this post.( It’s a fundamental reason)
Resistance Levels:
1. $9730
2. $10511
3. $10977
4. $10518
Support levels in case we break down:
1. $9233
2. $8757(50D MA)
3. $8688
4. $7400
5. $6763
My personal Bias is bullish unless $9200 breaks.
Thanks for reading. Do share this update with your friends, Wherever you like.
 @khalil