 @khalil
Bitcoin Chart Review Bullish or Bearish ?

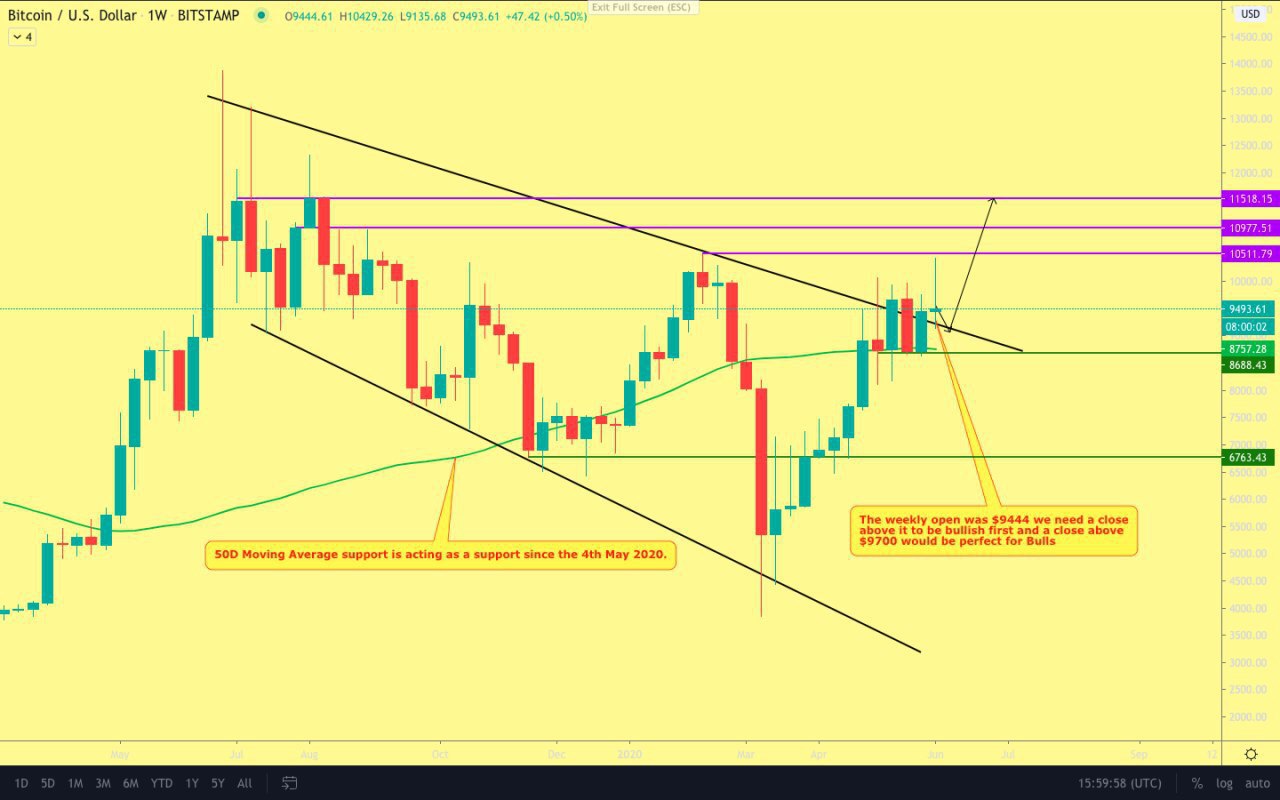
#BTC/USD 1 week Bullish or Bearish Technical Analysis: A DOJI candle above above Resistance is very bullish sign. All we need is a close above $9400 and then $9700 for being extremely bullish. Next 2 weeks will be crucial. We will see BTC heading to 10,000+ again (as per chart). Why do I think BTC is bullish? These recent dumps could be a for liquidating the high leverage late longs on futures before heading to the upside. Secondly BTC held the $9400 level which is a strong sign. I will share the third reason after this post.( It’s a fundamental reason) Resistance Levels: 1. $9730 2. $10511 3. $10977 4. $10518 Support levels in case we break down: 1. $9233 2. $8757(50D MA) 3. $8688 4. $7400 5. $6763 My personal Bias is bullish unless $9200 breaks. Thanks for reading. Do share this update with your friends, Wherever you like.
3 comments
I pray for bearish so that buying will be done for HODL and selling will be done as soon as the bullish surfaces.
i want moderators for bitcoin community can you please be a moderator
so you gona buy the dip🤑 if btc going down 👇good luck bro