Ethereum can drop to $15!
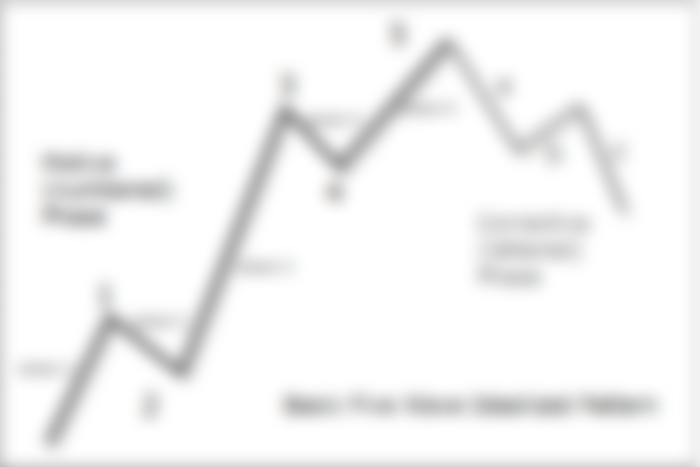

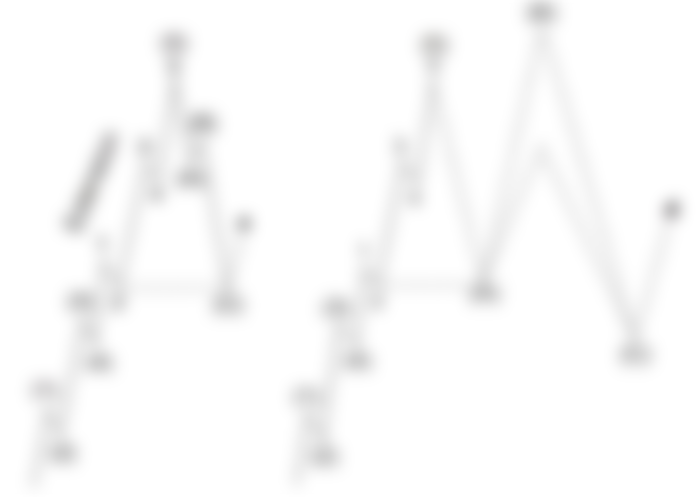
Elliott Waves are derived from human psychology of Greed/Fear. In a simple description, the uptrend/Bull cycle consists of 5 impulsive waves labeled 1-5 and the ensuing downtrend/correction consists of 3 corrective waves labeled ABC
After the correction (C wave), the cycle repeats. Note that impulsive waves have 5 subwaves and corrective waves have 3 subwaves
Secular Bear Market - 2018 to TBD
My entire premise for this article is that the bear market did not end on Dec 2018, it was only the 1st leg (A wave) of the correction, the early 2019 rally was a corrective rally aka Bull Trap (B wave)
A typical bull cycle lasts 8-10 years followed by 3-5 year bear market. There will be smaller bull/bear periods within. For example: Silver had a 10 year bull market followed by 4.5 year old bear market.
I believe Bitcoin (8 years) and other early majors like ETH/XRP are done with their bull markets from 2009-2017 and we are now in a secular bear market.
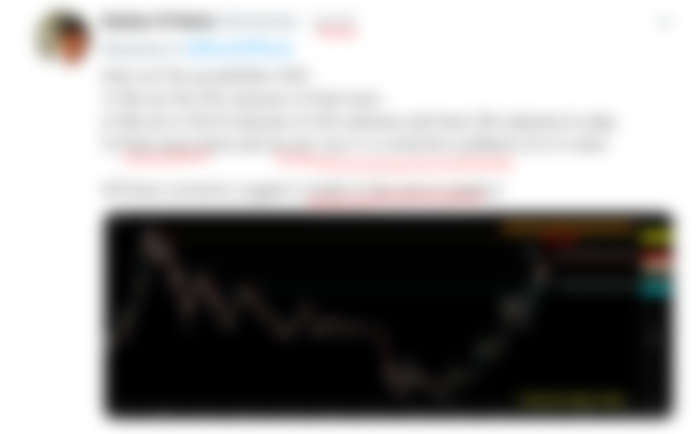
I tweeted about this and posted a chart forecasting the 2019 rally (till 8.5k) and it possibly being a fakeout as early as April when BTC was still $4.9k


Subsequently, I was able to call out the top in July based on this major assumption

Ethereum Bull Run - 1 million percent
Following this major but troubling discovery (In April) that Bitcoin is done with its 1st Cycle (2009-2017), I started look for other clues and in Aug, the full chart history for ETH came to my notice, until then I was using the chart from Bitfinex which did not have the early price history
Opening the chart (in Aug), it instantly appeared to be a perfect 5 wave completed and also the 2019 rally appeared to be a 3-wave corrective rally, a likely B wave

The weekly chart (below) looks like ETH is done with its impulsive 5 waves bull rally starting from Aug 2015 and ending in Jan 2018, with 2017 being parabolic which is congruent with an extended 5th wave


Here is why I think this is a perfect textbook style 1st cycle of 5 waves
We can see clear 5 waves (in green)
Wave 2 is deep (0.618), wave 4 is shallow/sideways to almost 0.382
The entire structure is divided at 0.618 near wave 4 bottom, which indicates again this is an extended 5th (also clear 5 subwavs in blue)

After every 5 wave bull cycle, there is a deeper ABC correction that goes up to 50% reracement or 0.618. Extended 5th wave cycles also correct sharp & deep, the textbook guideline says till subwave2 (here blue) of the 5th wave (green)

Also, entire drop to $75 was less than 0.382Fib of the bull run (2015-2017), which is too shallow after a 5 wave bull cycle
So, ABC correction started at 2018 Jan ($1600)
A wave = $1600 - $75 (End Dec 2018)
B Wave = $75 - $380 (End June 2019)
C Wave = $380 - ? ($15) (End in June2020?)
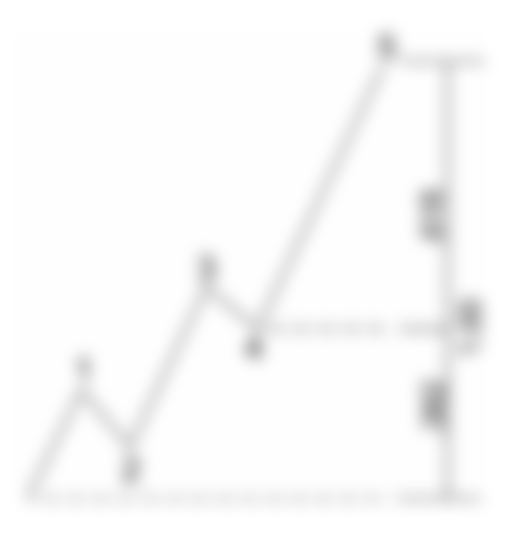
Here is the confluence for $15 correction
1. Major assumption: 5 wave are done, so next ABC correction is always deep
2. Correction is 3 waves (red ABC)
3. A textbook ABC correction is length of A:C = 1:1 (target area = blue box)
4. ABC corrections are usually confined within a channel, the current C wave will likely end at the bottom of the channel
5. The same target area, $15 also happens to be end of subwave2 (blue) of the 5th wave (green)
6. $15 is 0.5 Fib of the entire cycle, so 50% retracement
An optimistic target can be $50 which is 0.618 of (A), see blue line in below chart. It is also 0.382 Fib of the entire rally from 2015 - 2017. This target could be achieved by June 2020
RSI evidence
RSI on the weekly appears to be in a downward channel and keeps getting rejected at the channel, recently in 2019 runup, it made a double top and dropped below. I consider RSI below 50 as bearish , and after a 2nd attempt to breakthrough it failed again (red arrows)
2019 Rally was the perfect Bull Trap


As per my major assumption we are in an ABC correction, where A downtrend was completed by Dec 2018 ($75), and the subsequent rally was actually the B wave ($360)
Unlike an impulsive wave, a B wave is a corrective wave which has 3 subwaves (seen above) and usually confined within a channel
Reasons to think its a B wave
1. Entire price of 2019 rally is within the blue channel
2. It looks like a 3 wave structure, similar to the red ABC
3. Red C was 1.618 Fib ext of Red A, also green C was 1.618 Fib ext of green A
4. Red B rallied to 50% of A (0.5 Fib), the entire 2019 rally was to 50% (0.5 Fib) of the entire 2018 drop
Wave Psychology
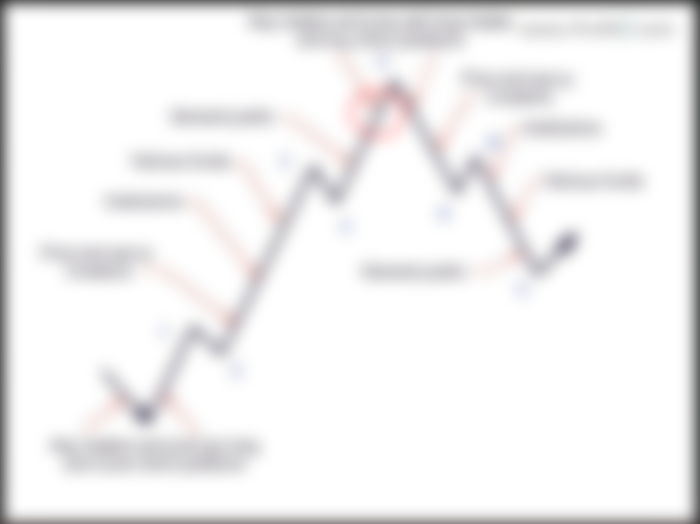

Elliott Wave is based of human psychology of Greed and Fear. So the top of the 5th wave is extreme greed and bottom of C wave is fear. So the 5th wave (blue) of the 5th wave (green) is euphoria, this happens to be after Oct 2017 (circled in red)- remember that time? everyone was making money including thinking it was the end to all our money problems
"Even if a fifth wave extends, the fifth of the fifth will lack the dynamism that preceded it. During advancing fifth waves, optimism runs extremely high despite a narrowing of breadth"
Section 2.4 from the book - Elliott wave Principles (https://www.elliottwave.com/Book/Elliott-Wave-Principle)
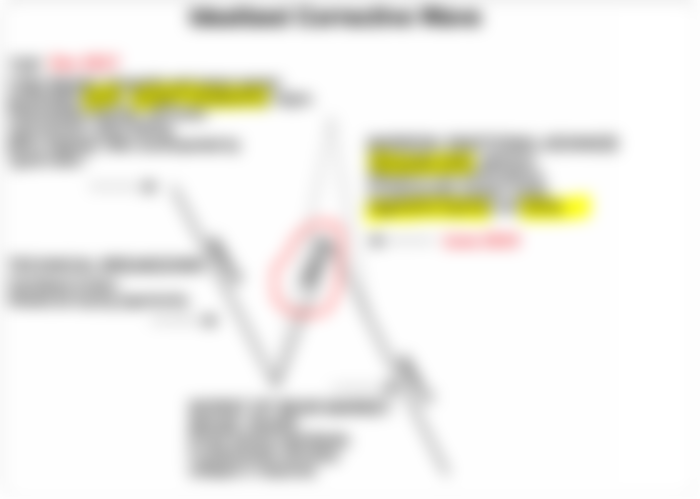
You know the textbook description of the B wave (Bull trap)?
Narrow emotional advance, technically weak (just 3 waves), selective. Results in non-confirmations. Aggressive euphoria an denial

Other assets for similarities?


Looking at silver chart, its also an extended 5th wave (0.618 divides at 4th wave) where the correction dropped till 50% (0.5 Fib), see green line above
Most (all?) EW analysts are unable to see that 5 waves are done, the simple count of 5 waves should be obvious instead of trying to fit a bullish bias. This is the reason the 2019 rally is expected (by them) to be the beginning of new 5-wave bull cycle, this will be proved wrong ONLY if we make a lower low
I believe EW analysts who run paid group are unknowingly (or knowingly) biased towards a bullish count for 2019 rally. Because otherwise, my chart means the market is going to die (almost) and so will their businesses. I've seen how this clouds their judgement.
But if you see charts of DASH or ETC, we already made a lower low recently which busts the myth that the early 2019 Alt coin rally was impulsive.
Alternate Bullish possibility for ETH


Here is an alternate scenario, where we make one more rally by taking support at the 0.618Fib area to targets T1/T2, after which we will resume the downtrend
The main chart & future updates will be posted in Trading View and in Twitter under @imkeshav
Featured image from Shutterstock
BTC can also drop to $15!