BCH was on it's bullish trend a week ago, some correction and consolidations are seen in BCH daily chart. BCH market capital is $26.53B and 24 hours trading volume at $16.19B
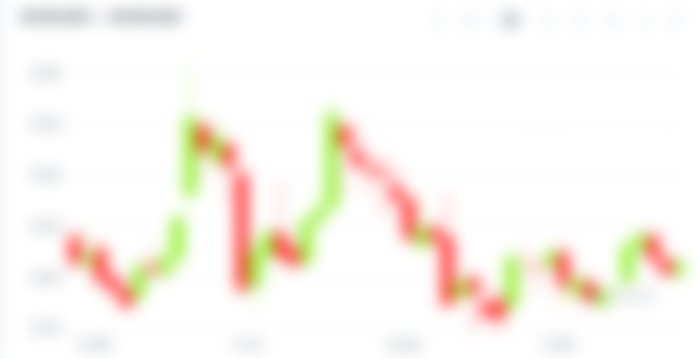
BCH at the time of writing is at $1,419.50 with chart seen as buyers dominated in the start of day and at mid of the day seen as sellers dominated. BCH with its resistance level at $1,607.08 and with its support level at $1,344.01. Here a price chart of BCH in the previous 24 hours:

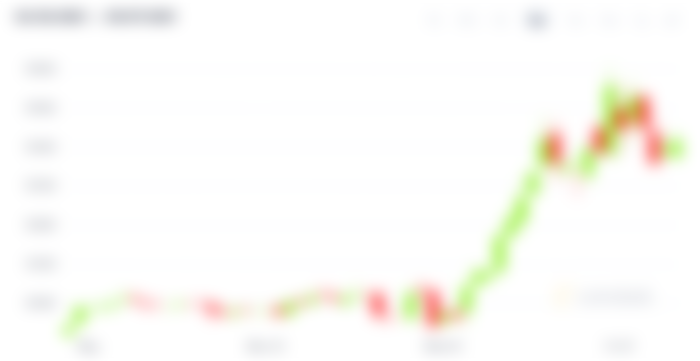
According to BCH weekly chart, BCH is on its bullish trend upward breaking its previous resistance level. Here a weekly price chart of BCH:

BCH would be seen even more bullish in coming weeks. As it tries to push beyond $1,500 price level or more. Let me know what you think about BCH upcoming trend.
Disclaimer: Article is only informative based, not an education on where to invest. If you are considering to invest do your own research.
Thank you guys for reading, liking, following, and tipping 👍
If you like, you can also follow me on Twitter.