Sovryn SOV technical analysis December 2023.
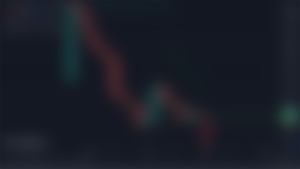
Sovryn SOV against Bitcoin printed yet another red candle for November, which could tell us that the price may repeat what it did in April 2022 which was print a single green candle followed by many more red candles. It could also do what the price action did in December 2022, print a red candle followed by a red candle to end with a green candle that made a short bear rally that took us to the 3700 levels but that was quickly sold off. You would see the monthly candle as your bias is, one thing is sure if bulls try to pump the price without volume it may happen that we will get a bear rally again, and buyers will just dump on by in the deep red investors, not to mention VCs looking for exit liquidity. So to me, it is bearish.
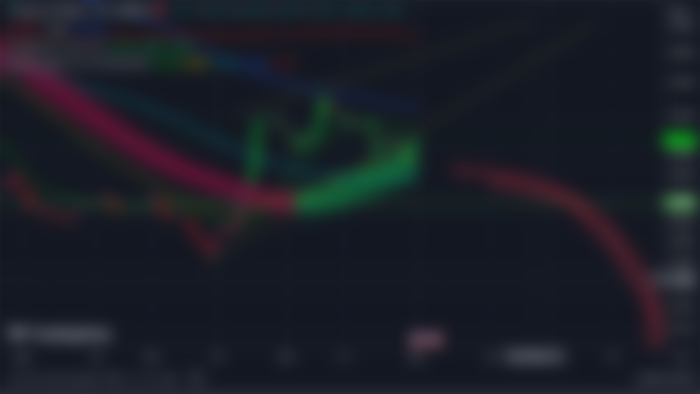
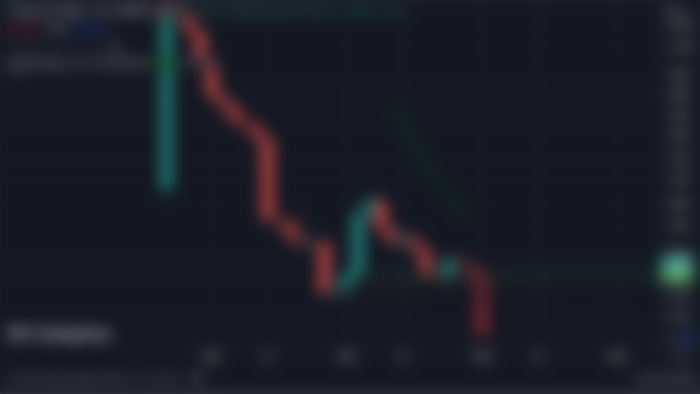
In the weekly, we have a clear double bottom that could be a repeat of last year's pump we will need to see some volume to test that. That in my opinion is bullish but we also have all the MAs as possible resistances, overall in my opinion the weekly looks bullish against Bitcoin.

In the daily, it looks bullish because the price bounced with a double bottom formation but it needs to test and hold the 100MA and the 55MA so that we can put it bullish, as it is right now it is bearish with a potential to test those MA to turn it bullish.
The conclusion in the monthly could be either bullish or bearish depending on your preference, the weekly seems bullish in my opinion, and the daily needs to test higher MAs to qualify as bullish.
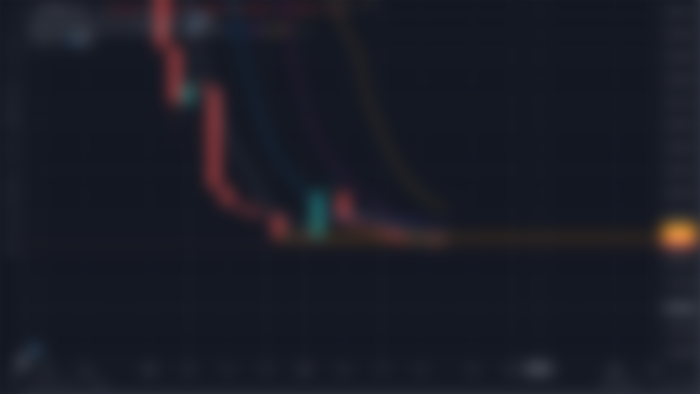
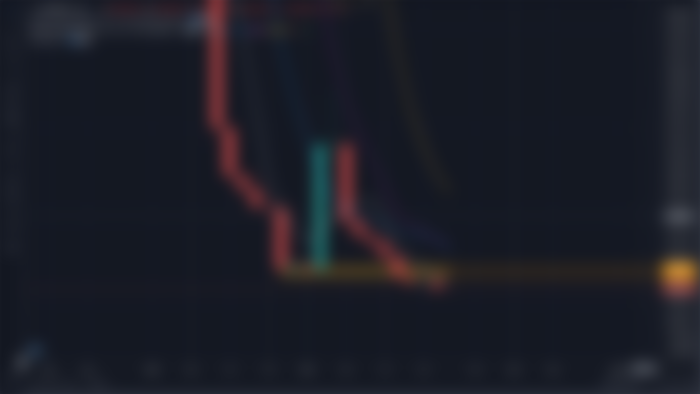
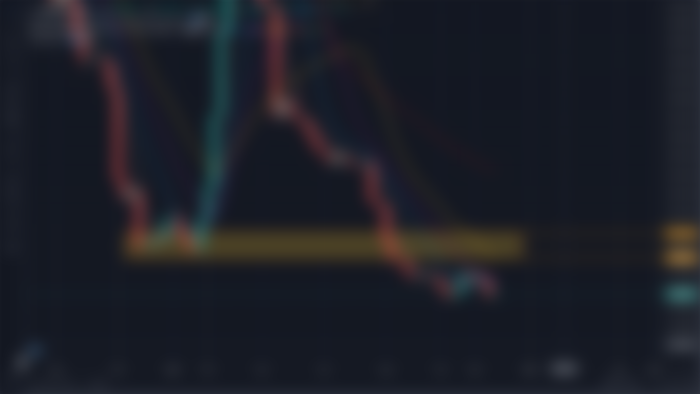
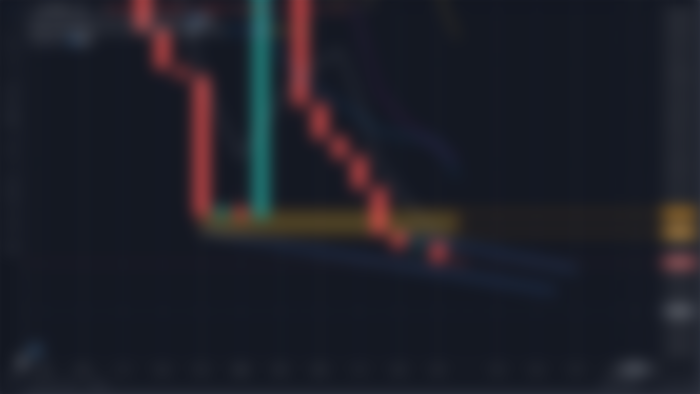
Against XUSD or USD it seems that the daily chart is still in danger of becoming overly bearish if price action doesn't manage to get away not just from the Gaussian channel but also to put itself from the previous uptrend trend line that is just to prevent future price drops. We need to get over the GC put some distance, and use the uptrend as support for another leg higher otherwise it could end up being just a dead cat bounce. To me, this is a bearish pattern with the possibility of converting itself into a bullish outcome 10 days from now.
In the weekly, it seems price action wants to touch the bottom line of the Gaussian channel and we have many support areas that could serve as the base to do that.
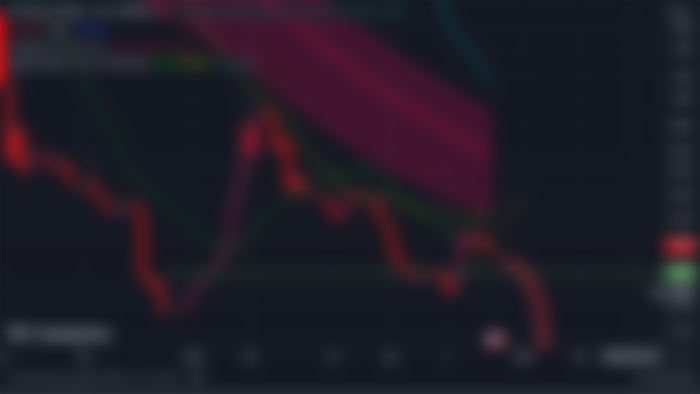
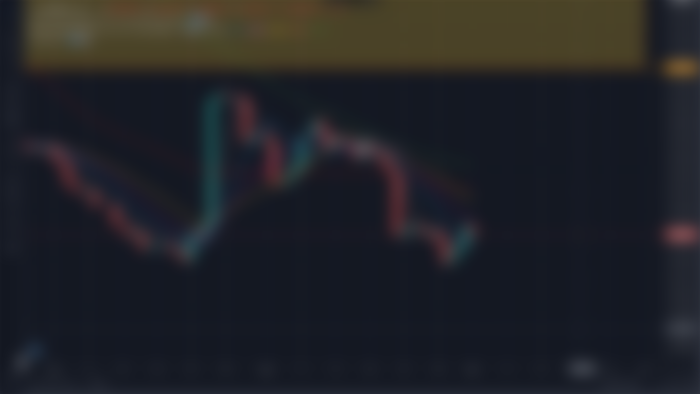
We have the short-term pattern in yellow that if used as support could help us get to touch the Gaussian channel, and the bottom uptrend that could help us use it as a support area for another leg in case the first pattern fails but if the price doesn't manage to test the GC and it is rejected the only support will be the uptrend line from the bottom and the last bottom itself. We don't have any MAs to use as support as such I will leave it as a bearish pattern.
In the monthly if we fail to break the GC in the weekly or if the chart turns bearish in the daily the monthly chart is showing us that we may have strong support at the uptrend line from the bottom as the last resort.
Conclusion.
If you already hold some Sovryn you are better off keeping them and just dollars or Bitcoin average in with new money once support areas are broken. Trying to trade the Sovryn market will be a bad idea because whales can manipulate the market without any restraint since they hold most if not all the liquidity. Technical analysis should only be considered as an entertainment tool at this state of the game especially if you are not the one behind the TA. What I mean is if you are going to trade using TA you are better off creating your own and not following anyone else's TA.
This post is meant to be for the Sovryn community at
https://t.me/sovryncommunity