
London's open and Asia have sold off the futures market from the open. In this post we'll look at the price action over the last hours, see how we can spot the downtrend and follow it and plan some trades that may become active through the day.
Spotting a trend against you
Anyone who's into the crypto space in the last 5 years has yet to experience a really strong trend against the bulls. "I got through 2020, buddy!". Yeah ... that wasn't that bad. Being caught against a trend can last a lot longer and be a lot worse. Here we'll look at determining a short term trend and understanding intraday bearish price action.
Trendlines
Trendlines are always the most obvious way to determine the direction of the current trend. The secret is when they're pointing down the market is going down, and when they are pointing up the market is going up (Shh. Don't tell anyone I let you in on that). In the futures market here on the 15 minute chart we can see all the longest trendlines will slant down.
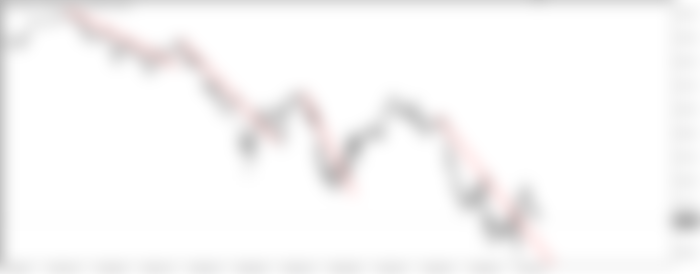

These are trendlines of moderate importance. Price is crossing over them pretty easily. So these have some very limited utility in using them as resistance levels the market might fall from, but you're probably looking at 50/50 win rate, maybe 40/60 against you (Probably getting 1:2 pay out on the trades, so not bad odds but not highly accurate).
On the other side of that the bullish trendline breaks are very good signals.
After heading up and coming back down we have very solid breaks and running trending moves. The trendlines I've drawn in have 100% success rate but I'm drawing these with hindsight and smoothing out some of the move. In real time you have potential to pick up more false signals, but probably still at least 70% win rate here on 1:2 pay out.


Key points: When longer trendlines slope down the market has been downtrending and while carrying momentum will continue to downtrend. The reverse is true for an uptrending market. When price crosses a counter-trend line, good opportunities to join the trend at the end of a correction are presented. Stop losses should go above previous high/lows.
Moving Averages
Moving averages will track the mean price of the last set amount of candles. Again the super secret stuff, when it points down ...
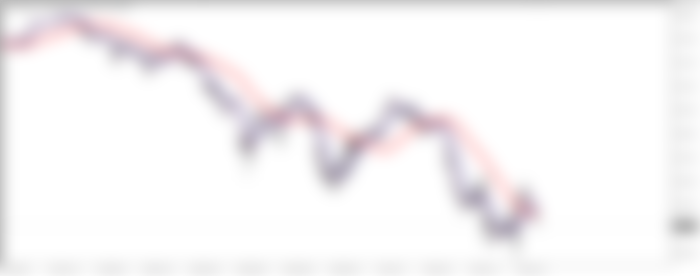

Here I'm using a 200, 50 and 20 moving average. Meaning one is tracking 200 bars, one 50 and the 20. The 20 one will react much faster to market moves than the 200. We call these "Slow, medium and fast" moving averages. For convenience in seeing which is which I've fattened out the slow one and thinned the fast one.
Again we have the same thing with crosses of the medium and slow moving averages. The crosses up generate false signals (If you use them to buy). Crosses down are triggering good trades. The more these three moving averages fan out the stronger the trend is. The more they tangle up the more we are ranging or getting reversal warnings.
Key points: Moving averages can help determine short term momentum, overall trend and entry/exit opportunities upon price crossing moving averages or different speed moving average crossing each other.
Lower highs and lower lows
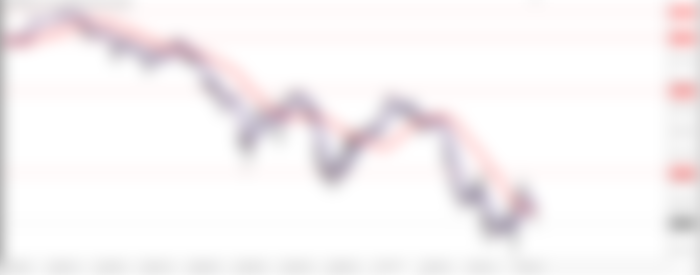

All the bounces take price up to a lower price than it was before the last fall and each fall takes price into a lower price than it was before. If you make the mistake of buying into a high point the market will never cross that price again (At least not without making some lower lows) - this is the true pain of being against a trend. If you buy when it looks good, it can be very bad.
Since for the trend to keep going it has to stay inside of the last highs, when the market is down high probability and pay out trades can be looked for by entering pending orders to sell very close to the last high. A lot of these orders do not trigger, but some are picking up great trades.
Key points: A trending market will keep setting new extremes to the side it is trending and keep making offering worse recovery prices to anyone trading against the trend. Lower lows and lower highs build an uptrend. Higher highs and lower lows build a downtrend. While this is going on, following it is often profitable.
Day's trade plan
Today we're starting to approach a big break level. If the market continues to trend when we get through that level there's probably going to be some trend accelerating and using the above tactics to enter into the counter-trend rallies is probably going to be the play of the day.
Follow this while these conditions keep going will be easy money, but it's not risk free money. Even if it's going to continue down and down there's always risk of counter-trend rallies breaking the recent downtrend. These are not a problem if you get stopped out and can just sell again a bit higher. Make all the money back. Never have had too much at risk.
If there is a break in the short term downtrend I'd expect to see it up into somewhere around here.
After there has been a big correction like that I will be ready to reload into my shorts. That will use up all the bullish ammo and if the market starts to fall again I can be more confident and a bit more aggressive in my trading. Especially under here. Sometimes selling low is a good strategy.