
Trading involves technical analysis, reading the charts and what each candlestick means and the shapes and indicators involved. A very useful tools for charting is tradingview.com. Tradingview has A LOT of resources, from livestream trading, cryptocurrency, and new ideas to look at, there’s a lot I haven’t explored that can entertain any trader.
So here I just wanted to provide some of the indicators that can help initial readings and possibly go into more complex indicators:
RSI (Relative Strength Index): Relative Strength Index measures whether a stock is being overbought or oversold. Lower RSI indicates people have sold more and that you could be looking for an increase in buying. Two points to watch are when RSI is close to 70, meaning it’s moving towards overbought, and 30, meaning it’s oversold.
MACD (Moving Average Convergence/Divergence): MACD helps show the price movement, moving average on a shorter period versus a longer period. Tradingview shows a shorter exponential moving average as blue with the signal line, the longer exponential moving average, as red. The short EMA will always meet the long EMA but it helps determine possible uptrends or downtrends when the blue line crosses the red line. Crossing downward is bearish and upward is the opposite. MACD can contain gold and death crosses. Gold Cross has the blue line shoot up through the red line, creating a cross and a bullish indicator. Death Cross has the blue line drop through the red line, a bearish signal.

MFI (Money Flow Index): Money Flow Index is similar to RSI in that it can also help determine overbought or oversold areas with usual indicators at 80 and 20, similar indications to RSI. Using MFI with RSI can help spot divergences. If RSI and the stock go up, but MFI is down, this can signal a reversal in price.
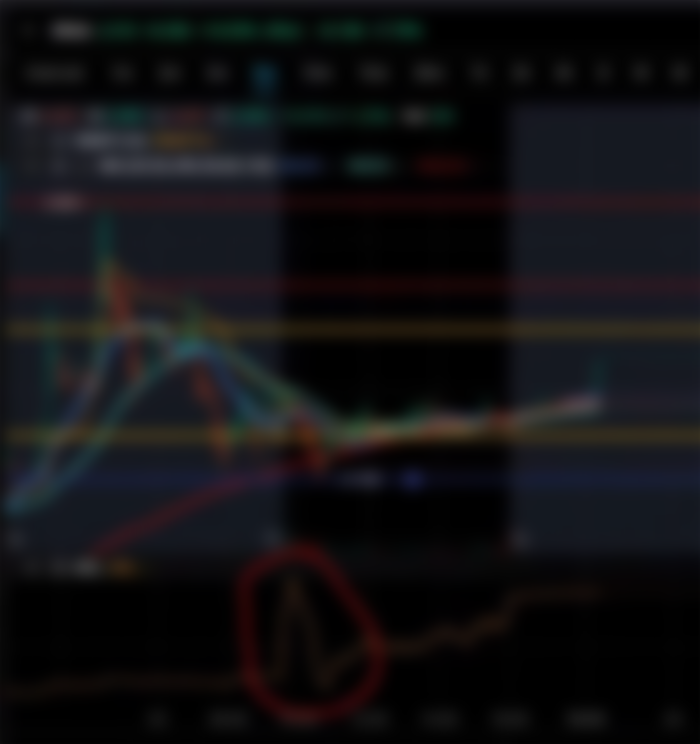
ADL (Advance/Decline Line): ADL helps determine the amount of shares being bought or sold, a positive number showing more bullish indication and negative showing bearish. Spikes in ADL can show possible artificial breakout without justification in price movement. A great example below, we see a spike in ADL but not much of an increase in price, so shows possible fake breakout and artificial increase in truly advancing stocks.

Bollinger Bands: Bollinger Bands help identify when a stock might be trading outside their price range. Bollinger Bands are usually set at 2 standard deviations away from the price, as statistically, 2stdev is considered an outlier. This can help identify a breakout from its trading range or retest the Bollinger Bands and come back inside it’s range.
VWAP (Volume Weighted Average Price): is the average price the stock is trading at, taking volume into account. If a stock is trading above VWAP, you can most likely expect it to come down to the average price, tending towards equilibrium as economics rule #1.
Overall, it’s important to use multiple indicators as they can tell different stories, and using them on multiple timelines can also help you determine what the short term and long term prospects are. Please feel free to ask questions, let me know if you want me to cover any other indicators as it’s important to learn more and increase our arsenal for successful trades.

মঙ্গলবার দুপুরে জাতীয় প্রেস ক্লাবের সামনে থেকে অপহূত শিশু উদ্ধার অপহরণকারী গ্রেফতার করে পুলিশ পরে তাকে উদ্ধার করে পুলিশ পরে তাকে উদ্ধার করে পুলিশ পরে তাকে উদ্ধার করে পুলিশ পরে তাকে উদ্ধার করে থানায় নিয়ে যায় সেখানে এখন এখন বল তোর দাদু খুব দরকার ছিল