Some Cryptocurrencies To Watch Out For This Month.
BTC kicked off the year on a losing red side, dropping about 20%, its worst performance since January 2018. Now all focus is on February which according to data gathered from previous years have always favored the bulls or buyers aside from 2014 and 2020 which had a negative effect on buyers.
The recent down trend in BTC have turned JP Morgan analysts bearish as they agree that increased volatility could hinder further institutional adoption of BTC and crypto in general. To further demonstrate this, in a note the analysts have reduced their long term theoretical BTC price target from $150,000 to $38,000, whoops that is quite a drop there…
If the recovery of BTC extends, some alt coins could attract aggressive bulls. So let's take a look at top 5 charts on my list for this month:
BTC/USDT

ETH/USDT
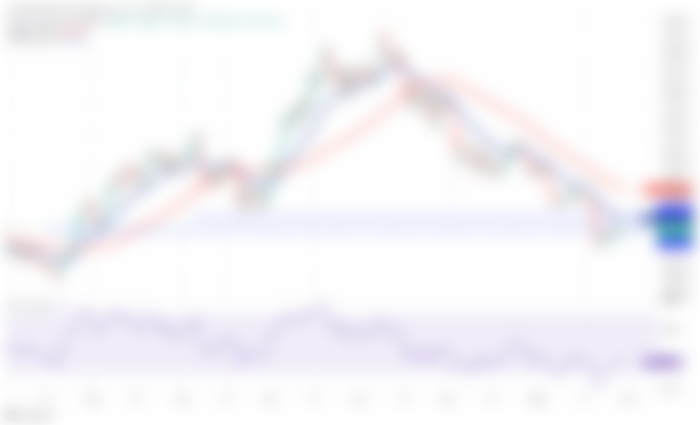
There is resistance near the breakdown level for ETH at 2,652, however a little bacon of hope is that the bulls haven't yet given up their positions. This suggests that traders are still buying the dip. The bulls would try to push the price above $2,652 and would hang around $2,802 at the 20 day exponential moving average (EMA) If they succeed. If this happens, it would be a sign that lots of traders have stopped selling suggesting an upward trend once again. However if the opposite happens and price turns downward instead of its current level, sellers or bears would try to balance ETH/USDT pair $2,159 support level. And this might lead to a further sink to $1,700.

SOL/USDT
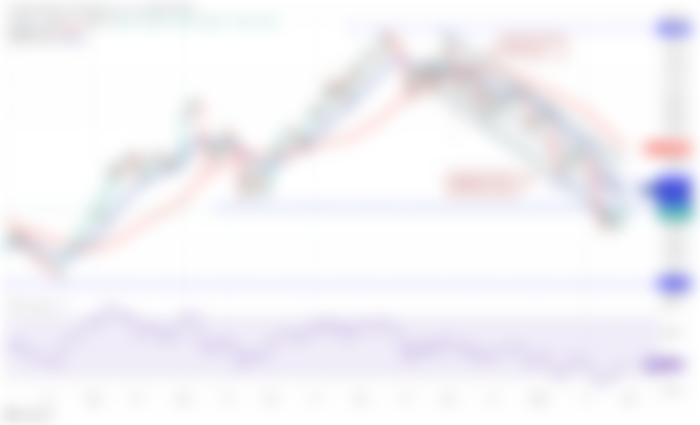
Bulls or buyers have been trying to push the price of Solana above $104.82 within the past few but prices have been bouncing between $80.83 and $104.82. Since the bulls couldn't push the price above $104.82, now the bears would try to pull it down below $80.83. If this happens, the pair could resume it's downtrend and fall to $66.03 if the bulls once again fail to remedy price at the support line. However if price rises a bit above $80.83, the pair may extend its stay inside the $80.83 and $104.82 range for a few more days. There might be a weak up trend if buyers try to push price above $116


DOGE/USDT
Doge has been trying to break out of it's resistance having been revolving around $0.13 and $0.15 for the past few days. Bulls are nearing support but have not yet had success quite yet. A relative strength index(RSI) indicator analysis shows that a bullish trend is forming suggesting that selling pressure may be reducing. But if the bulls or buyers fails to push price above $0.15, the bears may try to pull down the current pair price below support level. If the pair closes at $0.13 this could result in further selling. Driving prices down to $0.10. bulls would have to sustain price at $0.16 in order to ward off short-term sell from bears.

BNB/USDT
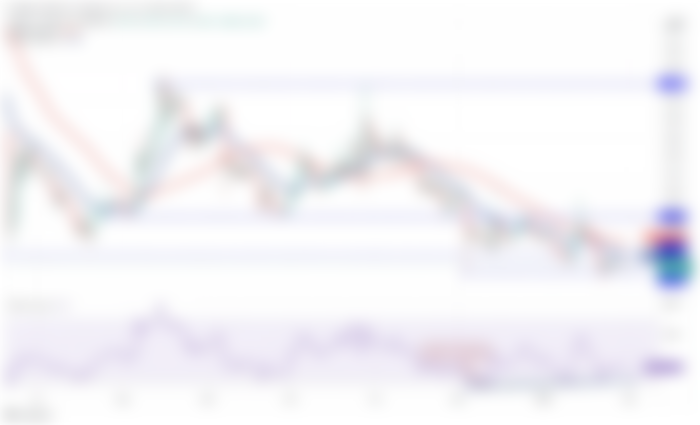
Bears are still much interested in pushing Binance Coin further down even though it's re-entry on Jan 25 hanged around $400. If bears further sink and maintain the price below $400, the BNB/USDT pair could again retest the critical support zone at $330 and $320. According to certain indicator analysis like the RSI, studies are showing that sellers are holding their positions strong. There could be a further dip to $250 if the support at $320 is broken as traders are likely to sell in panic. This negative view will neutralize in the short-term on a break and close the 20-day EMA. Opening a space for a new rise in resistance line.


I would love to hear from you on what you think, and if you guys like this kind of update I can be making them every month. Feel free to check other works I have put out too : )