Introduction
I have written a number of posts on a different platform and wanted to write a new post instead of just re-posting information on Publish0x. I prefer to write on more than just cryptocurrency but for my very first post here I'll consolidate everything I have on Bitcoin.
History
One of the most confusing things about the crypto space is the vast amounts of information available. Since it started looking like this market cannot be stopped anyone remotely capable of writing a post or making a youtube video has done so. It has been difficult to gauge who has the right idea of what will happen. Some have come close but most of the crypto influencers are not posting anymore or they have terminated their crypto youtube channels mainly because they could not predict the current bear market. One of the most impressive gains that I saw was a influencer that bought 70k XRP at US$0.005 each. He got out on US$0.2 and even though en made good money he had to terminate his youtube channel because of bad planning. I followed this chap for a long time and made some bad investments based on his advice but after he terminated his channel I decided that I had to do the hard yards myself and start to make my own decisions.
Bitcoin Data
I thought that the best place to start this journey was analyzing the Bitcoin price action seeing as it has been the main driver of the market and it has the longest data set. It was not as easy to obtain the data for free but I managed to combine two data sets (Mt Gox and Bitstamp) using Bitcoincharts and cross checked this with data on Coinmarketcap. The below graph was generated to show the different data sets (notice the massive price dump of the Mt Gox debacle after August 2013 in grey). If you want the data just drop me a comment.

Finding a Trend
I spent months analyzing the data, breaking down the set and extracting periods which I thought represented a cycle. I made a few predictions just to get a feel for the direction to take and some of my graphs can be seen below.
The first graph shown below was the percentage gains from the bottom of a cycle to the top of the next cycle and the days from the top of a cycle to the bottom of that same cycle.

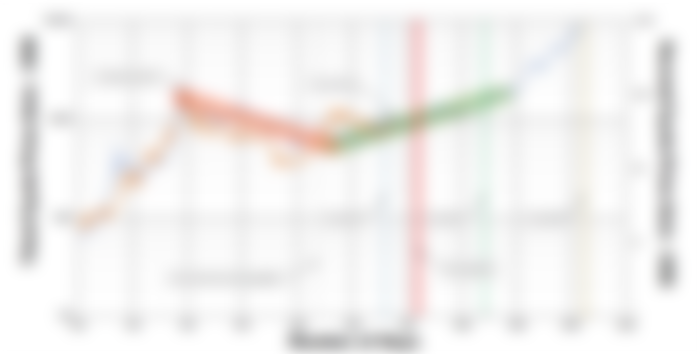
I also plotted the price action of Bitcoin on a Log-Log graph as seen below. The trends were fitted through the bottom of each cycle and the equation for each trend is also provided. You can generate the graph yourself by using these equations and substituting "x" with numbers from 1 to "n" which represents days or a 24 hour period.


My initial thought was to try and get an overall trend for the price of bitcoin as seen in the below graph but I quickly realized that this would not work. It's going up alright but what is the trend it follows during each cycle. An overall trend line won't be accurate during a cycle and can be off by a large margin.


I then considered shorter time frames still keeping to the idea that one can find a trend from the previous cycle to the next cycle because the price moves on the bottom of the curve for long periods. I generated the below graph pinning the trend line to 3 points on the graph on more recent price action but this was also not accurate enough (although a bit closer). An interesting pattern emerged from this exercise. I tried to get a band for the downtrend from the peak of the last cycle (light purple and yellow in the graph) and thought that this could be a lot more accurate.

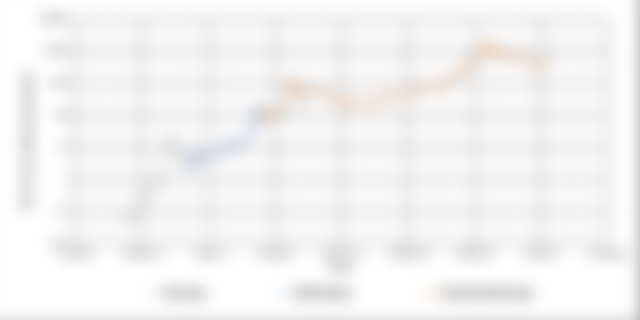
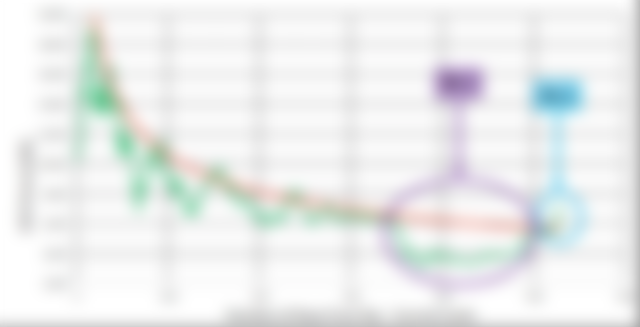
Dumping the data from the previous cycle and starting the period from zero at the peak, a down trend could be fitting beautifully through the data as seen in the below graph (current cycle data). Two interesting points are also shown on this graph. The purple being the "hash war dump" which is the period during which BCH and BSV forked. The light blue was the start of what I like to call the "Tether pump".
My stance at the time of this pump:
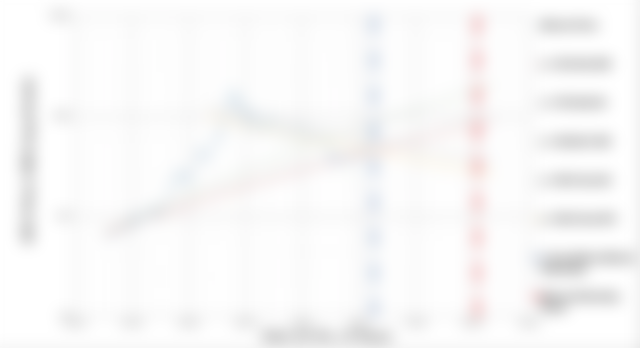
"We are at minimum 1 year away from the next parabolic bull run which would most likely start to occur after the Bitcoin halvening event in May of 2020. The current pump in btc is screaming for a correction as seen in the below graph. Under normal circumstances, we would have been trading sideways for at least a couple more weeks before slowly starting to increase."

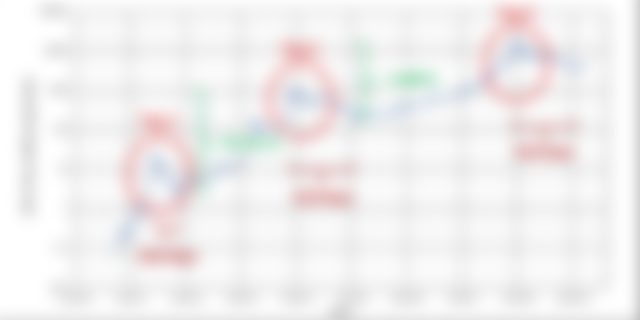
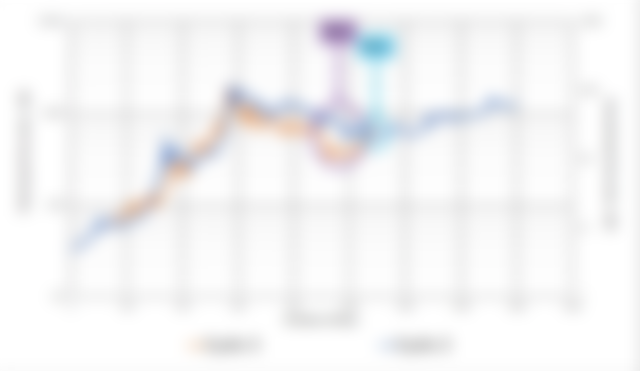
Further evidence to the above was the normal cycle trend especially the one prior to the current. An overlay of the two graphs is easily achieved by plotting the current price action on the primary axis and the previous cycle price action on the secondary axis as seen on the below graph. My comment at the time as follows:
"Another indicator we can use to point out the same two anomalies explained above is drawing cycle 2 and cycle 3 (current cycle) on top of each other as seen in the below graph (Ph 1 and Ph 2 stands out very clearly)."

I used the above method (overlaying price action of different cycles) to determine the equations for the downtrend and predicted uptrend of the current cycle (using the data from the previous cycle). The graph does not look like much but the equations were used to get the trend of the current price action.


I believe that the last mentioned method is most likely the best indication of the price of bitcoin over time for each cycle. When I wrote the post at the time (more than 9 months ago) it was the start of the "Tether Pump" and I was excited to see what the price would do in the coming months.
The Bitcoin Trend
After a proper correction from almost US$14,000 the price of bitcoin today is US$9,300 again looking like a correction is inbound. This correction might not be as dramatic as the previous one because we seem to have settled on the Bitcoin trend for this cycle (refer to below graph).