The basics
One of the first things I like to do when looking at the workings of a cryptocurrency coin is checking, not just the price but also the marker cap and circulation supply. We find our value in the price and we tend to stare ourselves blind refreshing web pages to see if it goes up or down but that should not be the way you look at it. Your coin could be doing really well be the price stays fixed due to an increase of the circulation supply. Yes, the price is important but you have to understand where it comes from. In order to calculate the price the following equation is used:


Example
For an example to show how price is calculated we can look at Bitcoin. One of the site I used most is Coinmarketcap, not because it's the best but because I know most of their shortfalls. The image below show that currently the market cap for Bitcoin is approximately US$175 billion and the coins in circulation is approximately 18.2 million.


Using equation 1 we can determine the price and check ourselves based on what the price shows in the above image from coinmarket cap.


Inflation
One of the most important aspects of a coin is inflation. That is the main reason Bitcoin was created, to avoid the inflation of the current fiat currency system. Inflation is mainly caused through the increase in circulation supply. This concept works more or less the same for any monetary systems, currencies or whatever you consider a form of exchange. The higher the inflation the more your coin (if you hold that coin) is devalued over time. In the traditional financial system inflation or increase in the circulation supply is achieved through fractional reserve lending, quantitative easing etc. and this has in the past lead to great debate. Mr Godfrey Bloom is one of the people that gets highly upset with the people making decision in this regard as seen in the below video.
Therefore, if you want to make sure you're spending time and money infesting in a coin, inflation is the main thing you want to avoid. It should however be noted that some inflation is not always bad. Systems might require incentives for use that lead to inflation but this is a whole topic on its own and will not be discussed in this post.
Inflation of Bitcoin
If we look at the last two cycles we can easily estimate the inflation rate for bitcoin for each cycle. The process behind this is far more complicated than what we will show here but we just want to get an idea of the approximate inflation. Inflation keeps on decreasing for Bitcoin because of Bitcoin halving se we'll estimate the inflation for the last two cycles. We will do this based on the circulation supply which we determined using equation 1. Please refer to the below graph. The blue line shows the circulation supply with red and orange the rate of increase in coins. The price was included for interest sake.
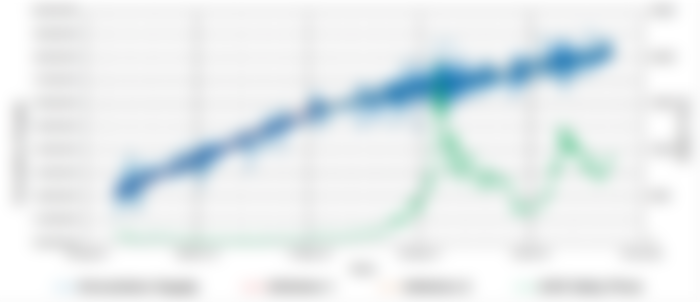

Cycle 1
There is a clear split between cycle 1 and cycle 2 which is the halving of Bitcoin rewards round about May of 2016 as seen on the above graph. Cycle 1 inflation is represented by the red line and inflation is merely the slope of the line. It equates to 11.9% per year over this period. One way to check whether we are on the right track is to look at Woobull charts which show that inflation over this period varied between 8 - 14%
Cycle 2
For cycle 2 (orange line in the above graph) we can do the same and determine that the inflation for this period is approximately 4.3 %. Checking ourselves again using the Woobull charts we can see that inflation over this period varies between 3.7 - 4.2%
Inflation of Ethereum
We can do the same for Ethereum (ETH) and see that this coin also have two distinct cycles during which the increase in circulation supply differs. Please refer to the below graph. Again the blue line shows the circulation supply with red and orange the rate of increase in coins. The price was included for interest sake.
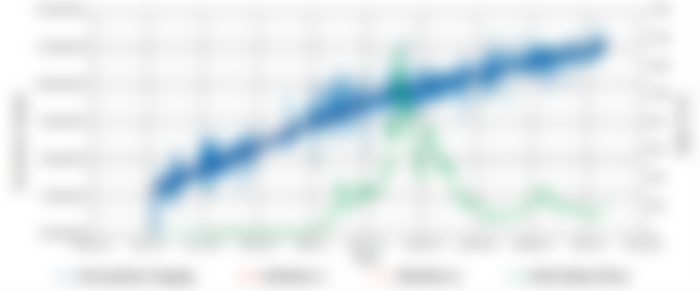

Cycle 1 (ETH)
The split for ETH is round about September of 2017 as seen on the above graph and the Cycle 1 inflation is represented by the red line which equates to 15.3 % .
Cycle 2 (ETH)
For cycle 2 (orange line in the above graph) we can do the same and determine that the inflation for this period is approximately 6.4 %.
Inflation of Ripple
For Ripple (XRP) it seems that after the initial coin offering there has been a constant increase in circulation supply since September of 2014. Please refer to the below graph. The blue line shows the circulation supply with red the rate of increase in coins. The price was included for interest sake.
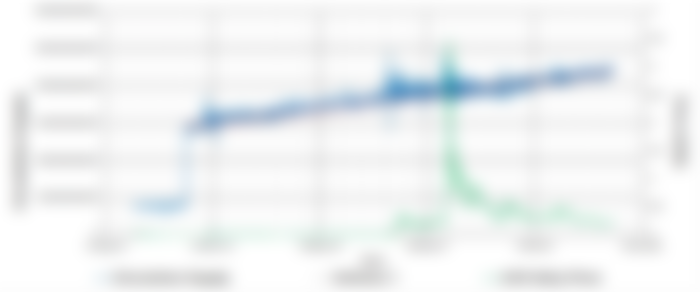

For XRP inflation has been more or less 10% since September of 2014.
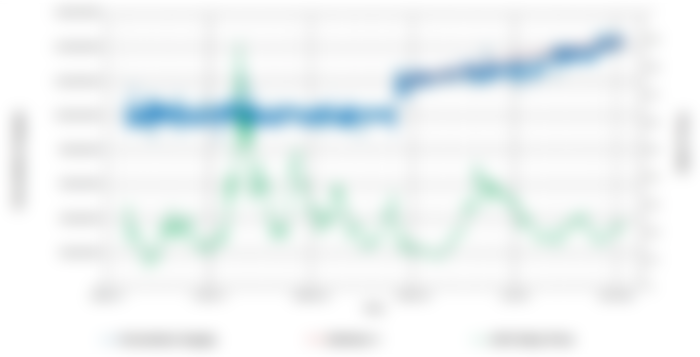
Inflation of Stellar
Stellar (XLM) is by far the most interesting coin to analyse when it comes to circulation supply. It has a number of periods of near constant supply followed by a massive pump in coins where it has come to settle in the last period since September of 2017. Prefer to the below graph. The blue line shows the circulation supply with red the rate of increase in coins for the last period. The price was included for interest sake.


This last period we are in now since September of 2017 has an inflation rate of approximately 5%.
Inflation of BAT
Finally we look at Basic Attention Token (BAT) used to drive the Brave Browser. It also show only one period during which inflation takes place that started after December of 2018 as seen in the below graph. The blue line shows the circulation supply with red the rate of increase in coins for the last period. The price was included for interest sake.

This last period we are in now since December of 2018 has an inflation rate of approximately 16.2%.
Price
If you haven't seen it by now, the main reason I keep on looking at increase in circulating supple (inflation) is its affect on the price of a coin. In the sections above I have shown how the circulation supply of BTC, ETH, XRP, XLM and BAT have increased over the past few years. But lets look at what that did to the price of the coins. I had to pick a point in time to start from and the marketcap, circulation supply and date can easily be crossed check on Coinmarketcap. First off we determine the price of the coin using the start marketcap and circulation supply. Then we do the same for current times (column under price named "Now"). This is the current price (more or less) with the increase circulation supply and current market cap. If we consider that the circulation supply of the coin stayed constant (did not increase of decrease) over the same period we can determine what the price would have been (second last column). The last column show the percentage difference in price due to the increase in circulation supply which is the effect of inflation on the coin.


Conclusion
Some inflation is good and ensures growth, system security, etc. but inflation can also be used as a method to steal from early investors. Remember this when considering investing in a coin in the future or even keeping your money (fiat) in the bank.
Insightful information. I think funds flowing into a crypto is the best determinant of growth and sustaining a price. Look at the top 10 for example. Move big time! Today was a fine example. Many altcoins lack the liquidity to keep their price up. Seems to fit the data well.