Bear
The past 3 years has been an emotional roller coaster that brought us from a high never seen before to a low no one wanted to believe. Some pessimists was convinced it was the end of Bitcoin and others predicted we would fall back to $1,000. We stopped falling at $3,400 and there was no meme that better described most hodlers than this one.


Market Turn
But the market turned. We shot up to $14,000 in about three months in an unnatural bull run and everyone thought that the moonshot was underway. We even had the so called experts (old maxipad wright) calling for a bull run within a bull run. Well, he recently brought out another video in which he explained that he was wrong. This is after an almost 7 month downtrend breaking back into the 6k levels. After touching the trend we bounced again and now sitting at $10,000 we are above the trend line for this cycle. Like I've previously explained in the Post - The Bitcoin Trend we should be seeing a good correction soon and if not we'll most likely intercept the trend in the coming days as we trade sideways.
The Bitcoin Trend
Most of the detail of the trend is included in my first post (The Bitcoin Trend) but I wanted to show more detail after seeing a picture of the three Bitcoin cycles underneath each other (see below).


One thing my graph was missing is the Halving date of the previous cycle to allow us to gauge the overlay not just from the peak points of the different cycles but from the halving mark as well. The overlay might have to shift forward or backwards in time depending where the halving line runs and if we decide to use it as the grabbing point on the overlay. First I deleted all cycle two lines from the graph to only show the cycle 2 price action as seen in the below graph. This cycle's graph is admittedly a lot more attractive than the cycle prior to it and the current cycle as it shows an almost prefect parabola. You could even, if you really felt like it, plot it out and find the radius of the circle it falls on.


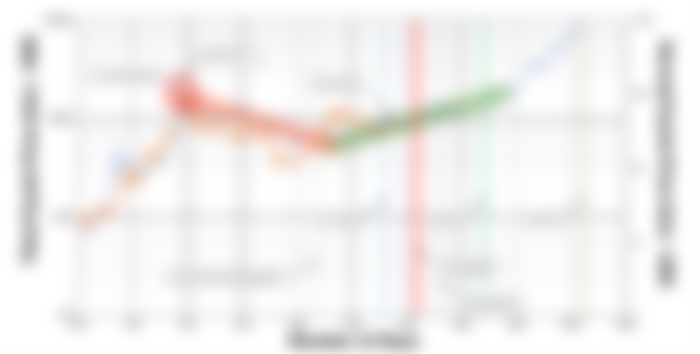
If we overlay the current cycle on the above graph we can see that, although not perfect, it tends to always return to the trend. We have seen a dump far below the expected trend and a wild pump when it was supposed to trade sideways but it has always returned to the trend seen on the graph. The grabbing point on this graph was the peaks of each cycle, marked in the red circle as seen on the graph.

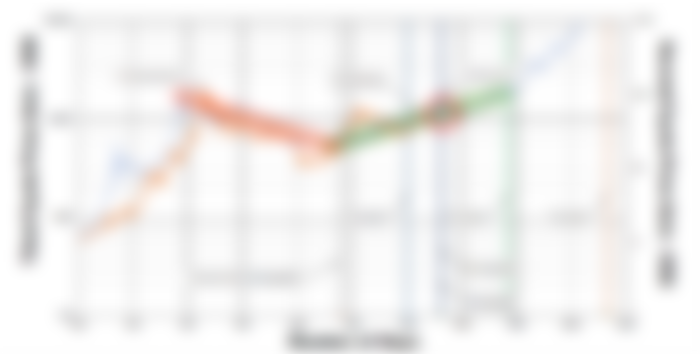
The alternative is to use the halving date as the grabbing point on the overlay to compare where we should be based on the previous cycle trend. The graph produced can be seen below. Surprisingly, this is not a bad fit at all. It even looks like the bottom points of the two cycles coincide. One thing that does not seem to line up is the fact that in the previous cycle we never broke the linear bottom that steadily crept up until we ran into the bull (latter half of the graph). If we consider this graph the trend, we dumped far below this linear line. This should however be investigated further because nothing in this cycle seems forthcoming. We had the massive hash war dump followed by a Tether pump after which we pulled back to the trend.

The Bitcoin Cycle
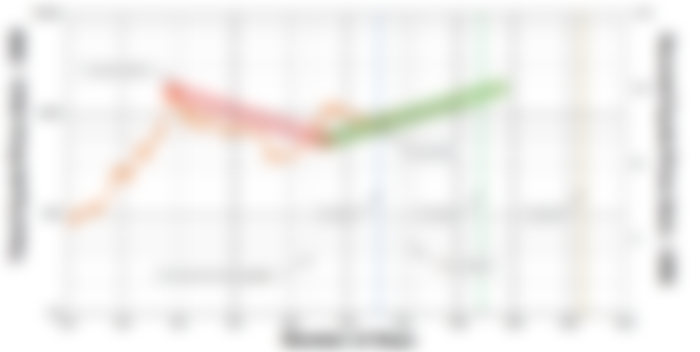
I am still of the opinion that the first graph produced is the trend we are moving along for this cycle's price action. The clean graph for this cycle's price action can be seen below and is based on a grabbing point of the two cycles's starting peak, as explained above.

I'll leave here a bit of motivation to become a hodler :-) Don't fall for the FUD.