It maybe sounds quite rare but there is some pleasure into applying past knowledge to nowadays situations to obtain results in a future. It's almost as if we rediscover old things to give it new uses....so yes, there is certain placer into applying this.
And we ask ourselves nowaday how people who lived 500 or 600 years before actual date discovered "things" that are so useful for nowadays events. And the point here is that some people from the past were smart and visionary...that's a fact...
Leonardo Pisano was one of those smart and visionary minds of the past wich discoveries in the field of mathematics still amaze us today. And if i tell you "Leonardo Pisano" maybe you could ask yourself who the heck is that guy i am telling about, but if i told you that this man was also known as "Fibonacci" or "Leonardo Fibonacci" then you will know immediately who I am talking about...so let's make a little history.
Leonardo Pisano(Fibonacci)
Leonardo Pisano was an italian mathematician who lived at the end of XII century and the beginnigs of the XIII. He was considered to be "the most talented Western mathematician of the Middle Ages".


Fig 1. Leonardo Pisano(Image taken from Wikipedia)
In his moment of greatest splendor he wrote his peak work entitled Liber abaci (1202; “Book of the Abacus”), the first European work on Indian and Arabian mathematics. He introduced the so-called "modus Indorum" (method of the Indians), today known as the Hindu–Arabic numeral system. The book advocated numeration with the digits 0–9 and place value. This book showed the practical use and value of the new Hindu-Arabic numeral system by applying the numerals to several aspects of the daily life but mainly commercial bookkeeping and trading...He will change the way the Western people saw the mathematics...forever!!!
Fibonacci Sequence
In his "Liber Abaci" Fibonacci posed and solved a problem involving the growth of a population of rabbits based on idealized assumptions describing the growth of the population as a sequence of numbers today known as "Fibonacci Sequence" where each number is the sum of the previous two numbers.

Fig 2. Fibonacci sequence example
This sequence was known by indian mathematicias from early VI century but it was Fibonacci who introduce this series of numbers in Western mathematics by the beginning of XIII century.
This sequence hides a strange surprise...and it is that if we take any two successive (one after the other) Fibonacci numbers, their ratio is very close to the Golden Ratio "φ" which is approximately 1.618034... In fact, the bigger the pair of Fibonacci numbers are, the closer the approximation.
Golden Ratio is, as you can see, a mathematical ratio. It is commonly found in nature, and when used in a design, it fosters organic and natural-looking compositions that are aesthetically pleasing to the eye.
It can be found in nature but Golden Ratio can be found too in several aspects of real life like:
1- Our Bodies: The ratio of the distance from the top of our head to our belly button to the distance of our belly button to the floor is in Golden Ratio.
2- Flowers: Take a closer look at a sunflower the next time you see one. It is said that these flowers grow in the Fibonacci Sequence number (I will explain this next). The reason is so that they get the maximum exposure to sun light.
3- Architecture: A lot of historical buildings were built using the golden ratio. The Parthenon and Great Mosque of Kairouan are some examples.
4- Paintings: The sacrament of the last supper by Salvador Dali, Mona Lisa and illustrations of polyhedral by Leonardo da Vinci were all said to exhibit the usage of the golden ratio.
So we have Fibonacci Sequence and the Golden Ratio derived from are applied to several aspects of real life and then, a question came to our traders minds: could be possible to find a use case of Fibonacci Sequence and Golden Ratio in trading too?
..the answer is simple: YES!!!
Fibonacci & the Golden Ratio in Trading
As an investor or trader, you’ve probably heard of this indicator called the Fibonacci Retracement. Many trading strategies have been developed using Fibonacci thru the years. From stocks market to cryptocurrency markets a huge number of trading strategies use Fibonacci elements to enter or exit in the desire position in a trend.
If you are a Technical Analyst, Fibonacci is probably your good friend. The Fibonacci levels that are used within institutional trading are 23.6%, 38.2%, 50%, 61.8%, and 100%. However, the Fibonacci levels more commonly used in cryptocurrency trading is 38.2%, 50%, 61.8%, and 100%. The 50% level is not a Fibonacci level per say, but stems from Dow Theory’s assertion that averages often retrace half of their prior movement. Nonetheless, these are levels that you’ll find the most support and resistance around.
Fibonacci retracements levels are, by definition, areas on a chart that indicate areas of support and resistance having in count the price; for Fibonacci Retracements this areas are limited by horizontal lines. In order to create these levels, you’ll need to draw a trend line between the lowest and highest price of a particular trading cycle.
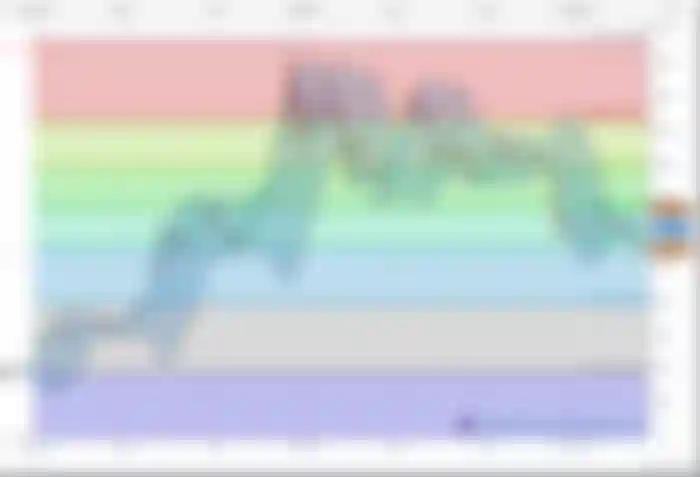

Fig 3. Here you can see some Fibonacci Levels(XRP/BTC Graphic from Coinbase Exchange data)
In the above graphic you can see an uptrend identified in April/2019, then choosing the tool of Fibonacci Retracements in your prefered charting solution(TradingView, GoCharting, ...) you can draw the Fibonacci levels as shown. Soon you will be aware that there are support and resistance areas where price "retraces" once it reaches the limit. This points at the graphics where candle chart almost touch the lines defined by Fibonacci levels are points of inflection wich traders commonly use to enter or exit a given trade position(buying low - selling high)
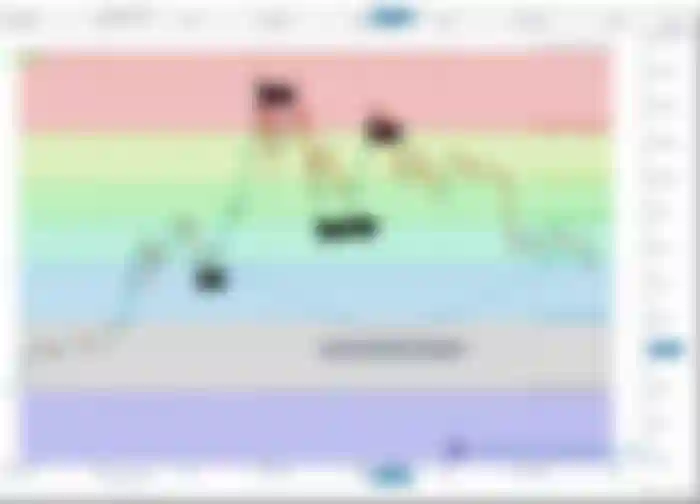
Fig 4. You can see places when you could have triggered short or long trades(XRP/BTC Graphic from Coinbase Exchange data)
From the above chart you can see 61.8%(Golden Ratio) level acting as a support level for the price.
Support levels are levels where the price tends to not fall below for period of time. An asset's support level is created by buyers entering the market whenever the asset dips to a lower price.(you can buy here)
Resistance levels are the point on a price chart at which an upward price trajectory is impeded by an overwhelming inclination to sell the asset. If a market price is nearing a resistance level, a trader may opt to close their position and take the profit, rather than risk the price falling back.(you can sell here)
Why are this levels important in trading?
This levels are psychological barriers that tend to repeatedly show up within the financial markets, time and time again. As stated before they are called inflection points where traders tend to anticipate a bounce or break off a resistance or support.
Another interesting aspect to Fibonacci levels are, the fact that the more people that use them, the more accurate they become. This tends to fall under the “self-fulfilling prophecy” paradigm.
The most important Fibonacci level, as you might’ve guessed, is the 61.8% level. This is a critical level where sellers tend to give up bargain-hunting and a potential mass buying frenzy will ensue.
You can use Fibonacci Retracement Levels even to predict future prices for not only cryptocurrencies but for stocks too. Looking at the periods of price fluctuations together with the level at which price candles are approaching, a very experienced trader would be able to guess in what percentage the price of some value can vary, up or down for the next few days or weeks.
ou need to have in count this tool is not completely accurate so the best thing to do is to combine this awesome tool with other indicators in trading strategies and if this indicators tend to overlap with the results of the Fibonacci Retracement Levels, this generally means that there is a fortified support and resistance to be expected.