Technical Analysis Lessons: Candlestick charts

Risk disclaimer: I am not a financial advisor, Trading involves risk, Please trade at your own risk.
This teaching will be specifically dealing with Candlestick charts.
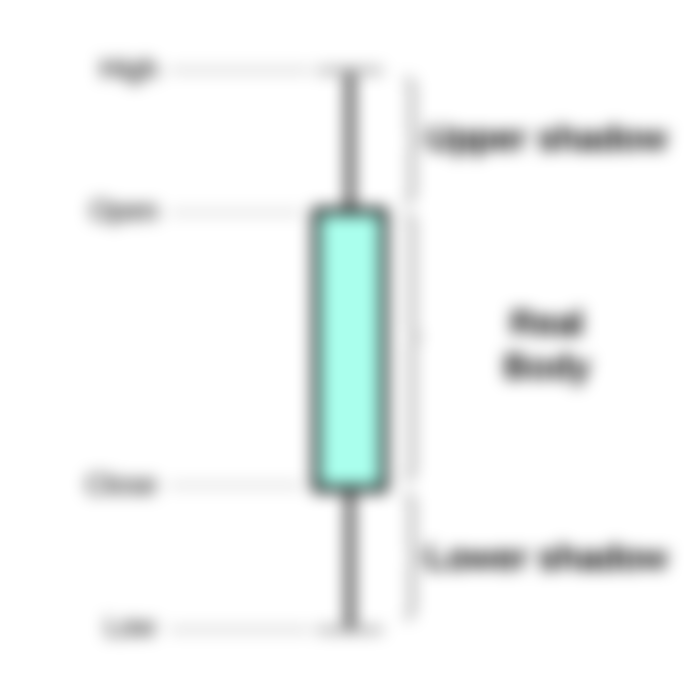
OHLC:
Candlesticks provide the information of the Opening price, the Closing price, the High and the Low of that particular candle. A single candle on the 5 minute chart represents 5 minute data of a particular stock, and a single candle on the daily chart represents the price data of a single day. The red candle represents that the closing price was lower than the opening price, and a green candle represents that the closing price was higher than the opening price. The upper wick represents the highest price point of that particular candle, and the lower wick represents the lowest price points of that particular candle. The candle bodies represents the open and close of that particular candle.
A candle closing are very significant meaning that a lot of things can change between the open and the close so a trader must wait a candle to close on a particular price level. The higher the time frame the more significant the candle close becomes.
Candlestick Patterns:
There are many candlestick patterns, I will only place the important ones in this lesson.
Doji: This candlestick represents indecision in the market.
Shooting star: A candle with little or no bottom wick with a huge upper wick, it usually represents a top of a trend or price rally.
Hammer: A candle with little or no upper wick with huge lower wick, it usually represents the bottom of a trend or price decline.
Note for beginner technical analyst: I mentioned in the previous lesson, the many factors in making an entry/exit decision. This applies to these candlestick patterns as Hammer will be found near support and shooting star will be found near resistance. As these patterns caused reversals, it may not be that much useful in a tight range or consolidation. Get in the habit of looking at the OHLC of a candlestick for marking out key opens, highs, lows and closes.

Thanks for your enlightenment