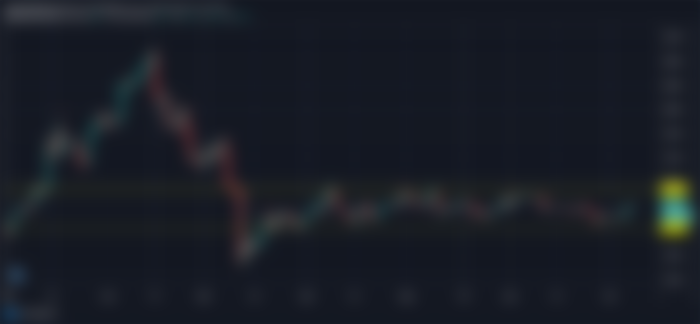
Hello everyone, today I want to talk about Bitcoin Cash that suffer by a huge sell-off in mid February as every other crypto, the -71% from the maximum till the minimum 30 days later was a standard for that bloody month. Since then we entered in a very long trading range.
Before start to analyse the chart lets see some statistic, this time there are some interesting numbers that we can read from intotheblock.com, even if the chart look like really bad we discovered that a 85% of BCH holders is in the money (they are gain at present price), just a 14% of the holders is out of the money, also the “large holders” statistic tell us something not usual for cryptocurrency with a long history like BCH, the holders that own from 0.1% till 1% and those that hold over 1% of the total circulation are just 29%, this number tell us that this crypto is mostly owned by small investor.
The fact that Bitcoin Cash is owned by small investor is also because the philosophy of this coin was to be used like cash and not just as store of value, this may be a good sign or a bad one, is just a personal point of view of the reader.
Another statistic that is a little bit strange is that the holder since 1 year plus are an astonishing 92%, the last minute owner (those that own BCH since one month or less) are just a 1%.
This short overview of Bitcoin Cash show us one thing, the holders are not going away anytime soon, many holders keep the coin in the good and in the bad situation, infact as a neutral person for this project I don’t feel love or hate for this currency but I noticed since day one that there was two fierce faction, I hope that this analysis will be enjoyed by both.
Lets stat with the YTD chart (since January 1), this chart show us that since march 20 the valuation is closed in a pretty close range, this trading range is a pattern that usually is short lived but this time is going on since almost 4 month ago.

The lower band of this range is set at the support of 203 Dollar, in case the trend will get to the downside we may expect a support at 216 Dollar before reaching the lower band of the trading range, we can notice that the 216 Dollar support is pretty much strong as the bears wasn’t able to breach this price many times in this few months.
Infact the trend would show a more interesting movement for the upper band of the range, the first resistance we find is basically the price where we are now than we must look a bit upward and at 265/ 267 Dollar we find the real battlefield where bulls and bears fight for long time, an intermediate level was found lately at around 258 Dollar but it seems that the real price will be that one of the upper band.
In case of a breakout of this range we may expect a run at 280 Dollar first and if this important price tag will be archived the trend may have no problem till the 304 Dollar resistance.
In the chance that we are able to keep the uptrend alive also over the last resistance bulls may run freely till 351 Dollar.
Personally I think that when the chart will break the actual pattern there will be a lot of volatility and we may see the creation of new levels (both support and resistance) that may change our analysis, then the caution must be great.
That’s all for now, thanks for reading and hope you enjoy this post, always remember to do your own research before investing.
