One of the most important factors in the Bitcoin Cash community is the focus on utility over price. It is refreshing in the crypto community and one of the things that makes Bitcoin Cash different from many projects which tend to focus on discussions on vertical price action by moonboyz. While I celebrate the technical innovation taking place within the Bitcoin Cash development communities including the recent deployment of BCH Smart Contracts, I am also keen on straightforward technical analysis in order to assess who is entering and exiting the market. Put simply price does have an impact on network performance.
Like many in the Bitcoin Cash community, I was surprised by the extreme volatility following the climb to $1,600 after what looked like a multi-year accumulation period. Although this is my first article on read.cash records of my technical analysis can be found on the sister site noise.cash - https://noise.cash/u/ZEEONE. I use a combination median-line analysis and Wyckoff analysis in order to determine potential movements in the market. With this in mind, this article is written for those of you familiar with the basic principles of Wyckoff analysis. For those of you who are unsure of what this means you can check out this link which includes basic descriptions and abbreviations for the forthcoming charts.
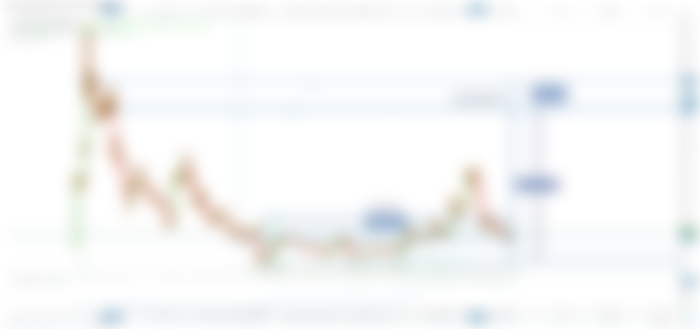
The recent lows in the Bitcoin Cash Gresyscale (BCHG) chart drew many peoples attention suggesting a massive markdown period following what I had previously proposed was an accumulation range in April 2021. My initial thesis was incorrect and the accumulation range was instead a large distribution range.
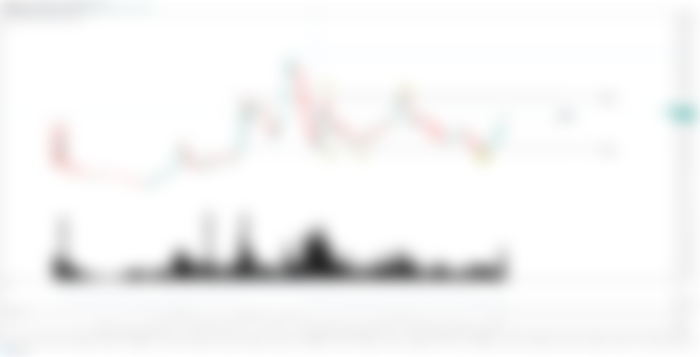

BCHG - 1 DAY - Proposed Accumulation - see zeeone noise.cash April 14th 2021.
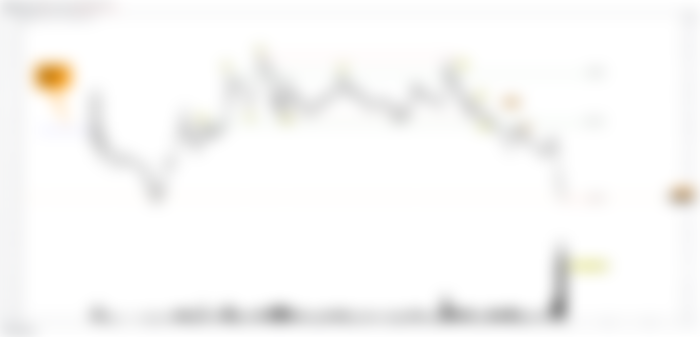

BCHG - 1 DAY - Distribution - August 02 2021 https://www.tradingview.com/x/4iSxiUwE/
My bias to accumulation of BCHG was based on an overall analysis of BCHUSD which I had developed setting targets of $1589-$1989. I was therefore extremely surprised to see BCHUSD hit $1635 and remain at that level for only seven days before starting a large markdown to $466. I believe this volatility also surprised Marc De Messel who commented on the price action in one of his recent live streams from a playground! Nothing like multi-tasking investors!

BCHUSD - Wyckoff Point and Figure Accumilaiton targets posted April 14th 2021.
A key part of technical analysis is backtesting and the issue of volatility has bugged me for a few months and has forced me to develop a new thesis on why we are seeing this type of movement in the market. The most important thing brought to my attention recently by Pantera in a combination of his articles on the Bitcoin Cash Greyscale Trust and in comments during a conversation on noise.cash is the twelve-month lock-in period for Greyscale Trust Shares.
"The OTC (over-the-counter) market this guy refers to is the exchange OTCQX. This is the secondary market BCHG shares are traded. After 12 months lockup period for BCHG investors can sell their shares there (and only there). This is the only market that Grayscale trusts are traded. The trust shares are also not reedemable, the investors can't redeem them for crypto through grayscale. The volumes were not very high in the OTC and it seems that someone tried to arbitrage the premium, (which was extremely high and even reached 2000% in November). But the premium to NAV is now a (slight) discount on that exchange (OTCQX). So this arbitrage trade only managed the profit from the rise in price in the last 12 months (probably doubled). "
Pantera - https://noise.cash/post/1q75jjm8
Volatility Thesis
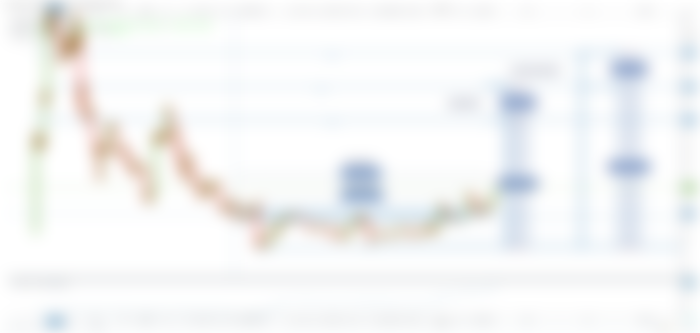
It would take a massive amount of volume to depress the price from $1635-$466. Retail investors simply would not hold enough Bitcoin Cash to dump into the market at that speed. Therefore it must be composite players (market makers) who are involved. In the chart below the overall scheme still fits a Wyckoff accumulation schematic with invalidation confirmed if the price goes and stays below $408.

BCHUSD-Bitstamp 1DAY https://www.tradingview.com/x/tDrTbPsL/
The volatility thesis is as follows:
The Greyscale Trust purchases Bitcoin Cash to support Greyscale Trust shares
Composite Operators take out Greyscale Trust Shares and hold for a year
Composite Operators move price up in the exchange markets
Composite Operators sell Greyscale Trust Shares
Bitcoin Cash is released and sold into the market by a combination of Greyscale and Composite Operators
Key here is the 12month lock-in period. Based on this time period we can backtest the correlation between BCHUSD and BCHG.
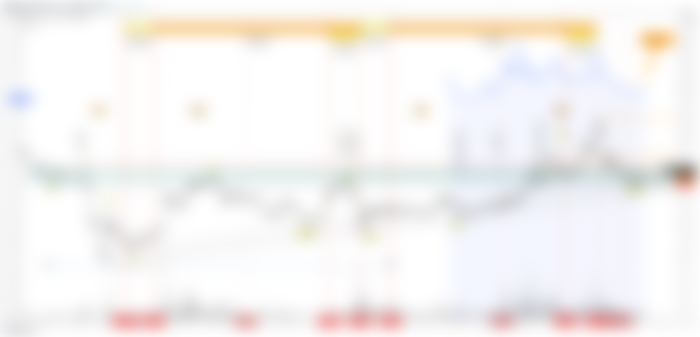

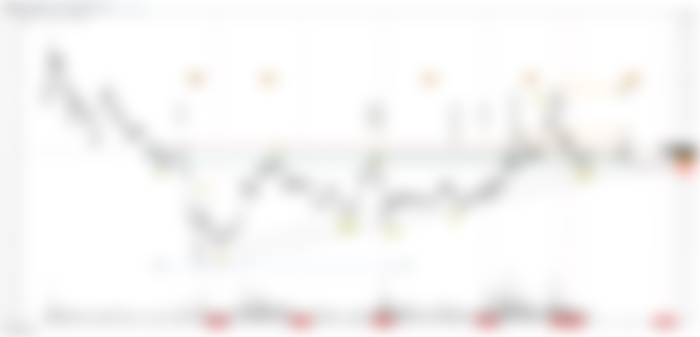
BCHUSD and BCHG Correlated Chart - https://www.tradingview.com/x/8h74Xh1Z/
As the chart shows the yearly BCHG lock-in coincides with major market events as mapped out through the Wyckoff method (yellow and orange measurement bands show correlation).
Initial buying of BCHG occurred following a secondary test (ST-PhaseB) of the BCHUSD lows in January - March 2019 which was sold into the halving and Covid Risk-off event Jan-March 2020 (Wyckoff Spring). Internal Accumulation periods of approximately 54-60 days (two months) followed by major selling into the highs March-May 2019.
Combined we can see the work of composite operators at play. Purchase BCHG shares at key market moments - mark up the price in the exchange markets (very low volume - compared to established trading markets) to raise the performance level of BCHG either to coincide with major events (halving) or with control over a year then sell.
Back to the Future
If the current markdown to $466 was part of a backing up reaction retesting the accumulation range of $75-$510 the next major highs in BCH may occur Aug-Oct 2022. Wyckoff Point and figure would put a target of $2575-$2895. I suspect that BCHG participants may have also made entries in Feb-April 2021 at the 510 key support levels. Therefore we may see markup in price in two phases with selling April-June (reaccumulation) into final selling Aug-October 2022.
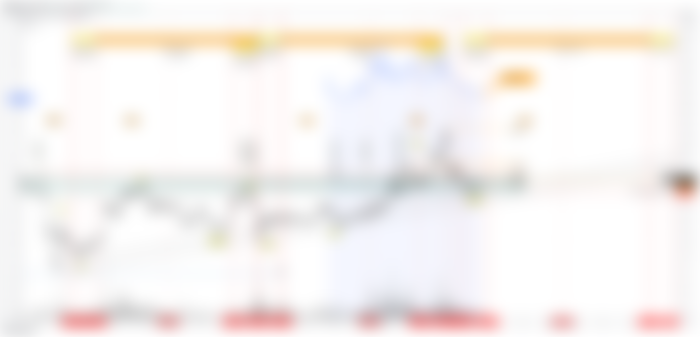

BCHUSD and BCHG Correlated Chart -Projected https://www.tradingview.com/x/isgaylpK/

BCHUSD - Wyckoff Point and Figure Accumilaiton targets posted August 02 2021.
On a knife's edge.
The above backtesting is fairly straightforward and shows a correlation between accumulation and distribution schematics of two different assets BCHG and BCHUSD. The main problem and why I have often used on a knifes edge in my noise.cash account is that price has to prove itself and the market has not yet shown a clear direction. Meaning that if the $408 dollar level is broken and traded under it would signify a major change in the thesis that this is BCHUSD is still in a large Accumiltion structure and very possibly a return to long-term range-bound price action.
I will have to revisit and read the post later. Sucks but I have not time right now. I don't know anything about Wyckoff analysis either, so it will be great to learn about it. Congrats on your first post on Read Cash Z1!