After experiencing a minor loss on the 20th of June, the crypto market has turned up its momentum as it crashes even further to create another strong bearish week, mirroring trends in the 2018 crash.
Briefing
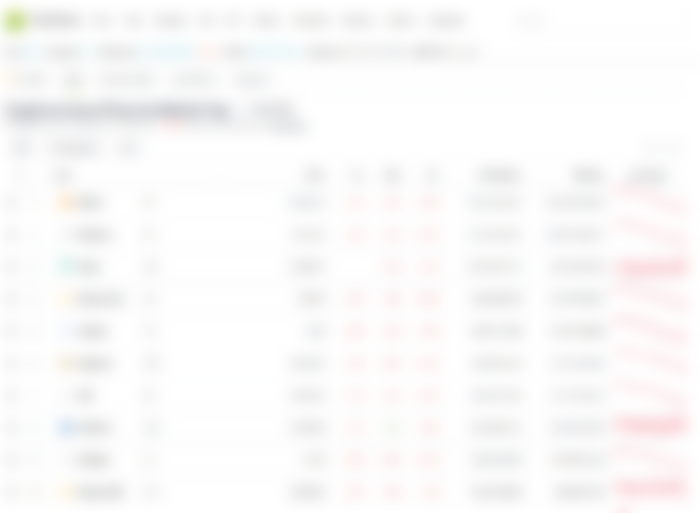
Going into the top 10 cryptocurrencies according to market cap, there have been some interesting changes to the market. Before detailing such changes, note that Tether (USDT) is not provided with a percentage gain/lose over the past hour, most likely from a glitch on part of CoinGecko where the leaderboard is attained.
The most noticeable and surprising change to the top 10 is the presence of Binance (BUSD), previously recalled around the 15th mark, and so having a great movement to make it to such a high position. It has a market cap of about $9.5 billion, over Uniswap (UNI) sitting around $9.2 billion - a $300 million margin. Between BUSD and UNI, there is a much higher trading volume over the past 24 hours in comparison to UNI's trading volume, which likely is what caused BUSD's rise to 10th place. BUSD has a 24-hour trading volume of more than half its market cap - about $5.5 billion - while UNI has a 24-hour trading volume of less than 10% of its market cap - about $500 million - which is less than a tenth of BUSD's trading volume. Although BUSD is presented at 10th place on CoinGecko, on other cryptocurrency listings BUSD is presented at 11th places, such as CoinMarketCap. This is most likely from the different accounting methods of market cap for each cryptocurrency, CoinMarketCap taking different crypto exchanges than CoinGecko.
Other than the great uprise of BUSD, there is not much change on other cryptocurrencies, each sticking to its position. However, there is a closing gap between XRP (XRP) and Dogecoin (DOGE), excruciating close at around $6 million, appearing that XRP will soon overtake DOGE and hold 6th place - another historic change within the crypto market in this bullish run. All cryptocurrencies have had red numbers, the only green with USD Coin (USDC) over the past 24 hours at 0.3%. The hardest hit of them all over the past 24 hours was Polkadot (DOT) at 10.7%, the less excluding US stablecoins Cardano (ADA) at 4.3%.

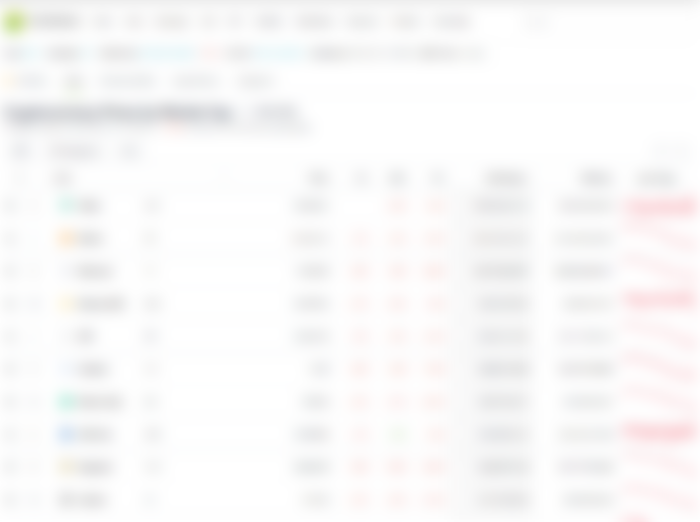
Switching to the top 10 in terms of trading volume over the past 24 hours, there is the usual leaders of USDT ($78 billion), Bitcoin (BTC - $45 billion) and Ethereum (ETH - $33 billion). Beneath ETH is another surprising appearance of BUSD at 4th place with, as mentioned earlier, a 24-hour trading volume of $5.5 billion. Following BUSD is XRP at ~$4.5 billion, and this high trading volume may be why XRP is close to overtaking DOGE for 6th place in market cap. For why XRP is having such a high trading volume is not directly known, but can be speculated on the rising popularity of XRP and recognition from businesses/banks that it was tailored for.

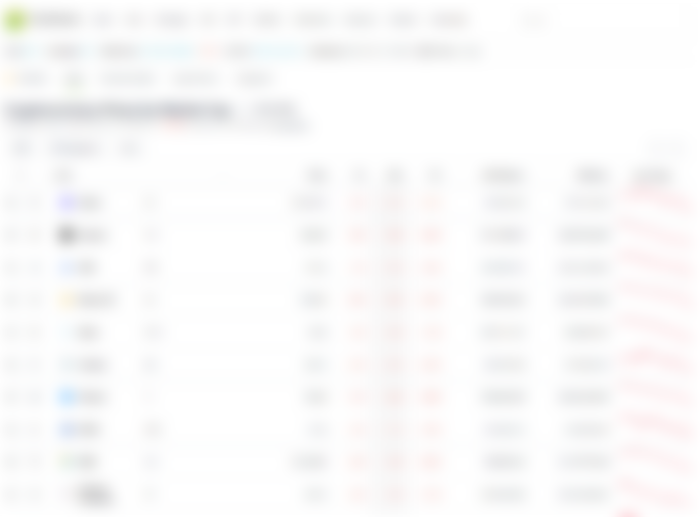
Moving to the top 10 losses over the past 24 hours for the top 100 cryptocurrencies according to market cap, the top 3 come with Stacks (STX - -14.2%), Kusama (KSM - -13.5%) and OKB (OKB - -13.5%). These are great losses for these cryptocurrencies, all of its following losers having over 10% in losses as well, which indicates that the market has been hit hard today. In this scope, KSM has the worst 7-day trend of -43.5%, almost a loss in half, which is also the worst 7-day trend for the top 100, followed by Internet Computer (ICP) at -37.2%. Looking at the Last 7 Days charts on the furthest right, there is an indication that a bullish week has been inflicted upon the top 10 24 hour losers, the most action occurring over the past day. This can apply to the rest of the market, thus being in a bullish week.

Replication Of 2018 Crash Trend
BTC has the highest market cap in the crypto market, holding about half of the total market cap, which means it would be a major influencer to its trends, and so a good indicator of the overall market trends. When looking at the maximum scope of BTC in CoinGecko, there is a surprising replication of the current trend to the crash in 2018, BTC currently in what looks to be the 'third stage' of the crash, or the right shoulder in other terms.


Looking analytically at the current BTC crash, there appears to be the 'head-and-shoulder' trend that occurs in three stages: left shoulder, head and right shoulder. The first stage, or left shoulder, is the beginning of the rise of a trend, which is visible from the start of 2021. BTC makes a bullish run from the left shoulder to more than double and breaks the $60000 mark that makes the second stage, or head. BTC remains at this head period for some time, around March to May, fluctuating up and down but holding a steady gradual incline upwards. Mid-May comes to the third stage of BTC or right shoulder. BTC crash downwards, returning to its original position of the left shoulder, which matches this trend.


Applying the head-and-shoulder trend to the 2018 BTC crash, there is the same trend, though at a much lower scale. Rather than having a low of around $20000 and a high of around $60000, the 2018 BTC crash has a low of around $5000 and a high of around $20000 - about a third smaller. What is important to note is that the 2018 crash was much faster than the current BTC crash, BTC in 2018 not maintaining its high in a stable position for a few months, only one to then taper downwards. For the current BTC crash, it remains around $60000 for a few months, then experiences a much more steep drop. The longer stable period for the current BTC crash indicates that BTC is becoming more stable and volatile at the same time since there is a much higher volume/use of it. Stable in the sense that it can sustain a price for longer periods, but volatile in its liability to crash much more quickly.


After the 2018 crash, BTC remains relatively stable, with no fierce trends occurring. With the current BTC trend following the one in 2018, BTC will likely crash back to around $20000 it caught towards the end of 2020, staying there for a considerable time before any new bullish runs happen. This would also apply in general to other cryptocurrencies, the market coming into what can be called the Dark Ages.
The crypto bubble has grown and grown over 2021, and it is the biggest it has been since its beginning, but it appears to have popped in May, now fading away.
Further Reading
Wikipedia - Cryptocurrency bubble - https://en.wikipedia.org/wiki/Cryptocurrency_bubble
CoinGape - Bitcoin Price Takes A Dips Again; Is Michael Burry Right Or Just Another Chinese FUD? - https://coingape.com/bitcoin-takes-a-dip-again-over-chinese-central-bank-fud/
be[in]crypto - EXCLUSIVE Polkadot (DOT) Struggles to Hold Support After Breakdown - https://beincrypto.com/polkadot-dot-struggles-to-hold-support-after-breakdown/
CoinTelegraph - China’s 3rd largest bank ‘rugs’ BTC: 5 things to watch in Bitcoin this week - https://cointelegraph.com/news/china-s-3rd-largest-bank-rugs-btc-5-things-to-watch-in-bitcoin-this-week
Forkast - Bitcoin and Ethereum prices fall: Is the crypto market in an over-leveraged bubble? - https://forkast.news/bitcoin-ethereum-prices-fall-crypto-market-bubble/?utm_source=rss&utm_medium=rss&utm_campaign=bitcoin-ethereum-prices-fall-crypto-market-bubble