How to have multiple measures on a chart
Hello guys
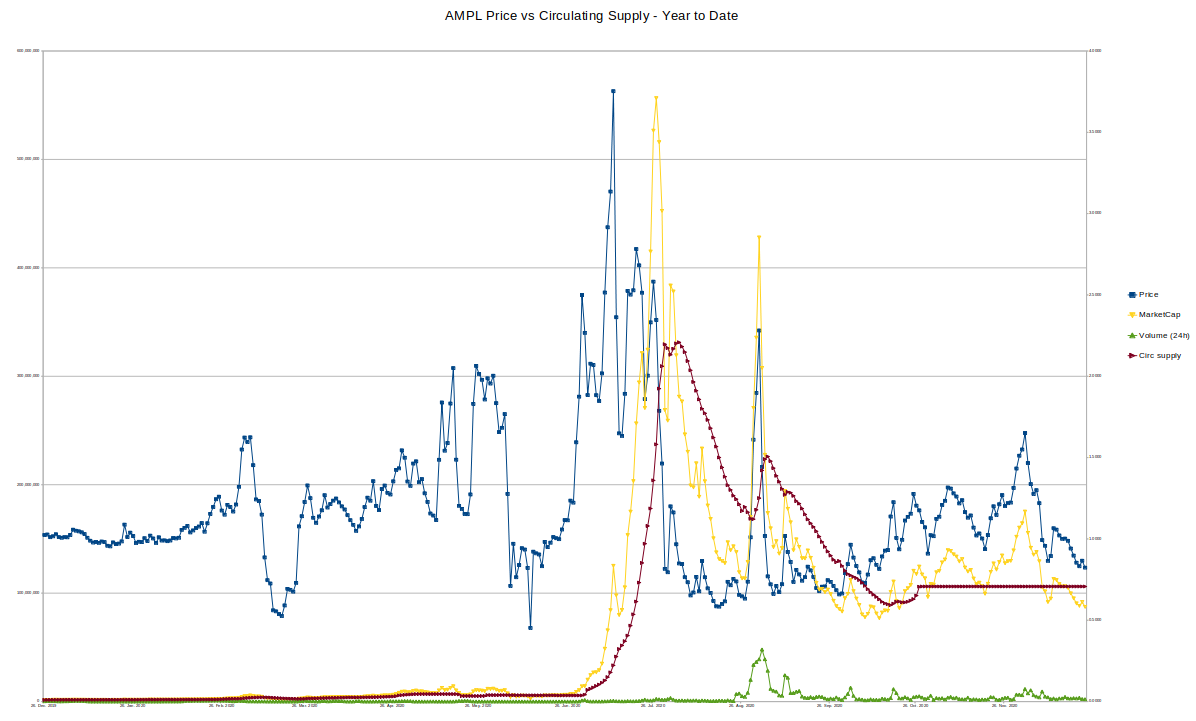
I was looking for how to explain better the Ampleforth mechanism because is a little more complex than others and I needed to show on the same chart two (very) different kinds of values: one is measured in millions and the other, in units!
So, I started to search. First, I was wondering what should I look for? Finally, I decided to find on the search engine for "how to show multiple axis on Excel" - because it is the most known Spreadsheet Software.
And I got several results. First one was, of course, an invitation to buy a software that is making this kind of things possible and, I am sure, has many other features, but I was not interested in this moment, I only wanted to solve my simple issue.
So, I looked foreward and I even found a video with the solution and it was exactly what I needed. In this way I noticed a difference (a Pro for Excel and a Con for Open Office): in Excel you can put different types of graphics for data series (some of them could be columns and others - lines).
Yes, I was very satisfied with his little demonstration and I can recommend it with all my heart.
If there is something you didn't understand, leave a comment and I will gladly help you.