I've seen a lot of posts recently about whether we have entered a bear market or not, so I wanted to share with you why I'm convinced at least for now that we are still in a bull market and this is just a corrective phase before at least another push to a new ATH. I'll break down my argument into 2 parts, macroeconomic landscape (wider economic landscape) and onchain data (data specific to bitcoin/crypto).
Macro indicators
Macro risk appetite affects crypto. In a risk off environment all players tend to seek refuge in cash or liquidity. In a risk on environment players perceive an infusion of fresh liquidity in the markets and as result resort to speculation to make sure they capture as much as possible of this new liquidity entering markets.
An analogy I like in this sense is that of an oasis in the middle of the desert. In every oasis there is a water pool and life flourishes around it. You can imagine how important this pool is, without its life in the desert would be impossible. Financial markets are organized in a similar fashion when it comes to liquidity. No matter how much an economy grows, liquidity will always be limited and it's something all players keep an eye on, just like the inhabitants of an oasis. Let's say now there is a huge block of buildings in the oasis inhabited by wealthy individuals who also happen to be the only ones to have an internet connection or access to geothermic data on the predicted inflows of water. So, what happens when this group of people learns that inflows of water are about to stop for whatever reason? Automatically they will start pulling more water from the main pool than they actually need (without having access to the information the rich people have), as they prepare for a dry season. The others around them will start noticing this, maybe they will notice the water pumps, and as result of this slowly everyone will start pulling more water from the pool than they actually need until dry season eventually comes. When it comes to liquidity in markets, something similar happens at the end of a bull cycle. The biggest players such as pension funds or huge hedge funds that have access to very good information, are the first ones to start pulling liquidity out of circulation. Once big players start pulling money out, considering the amount of assets they sell (the equivalent of water pumps in the desert, are assets being dumped at markets), they initiate a rush to liquidity that slowly propagates to the rest of the economy. Important here that most other players do not have access to any of the information of these big funds, however they react just like people in the desert react when they see a big block of flats is suddenly pulling water out to build up water reserves.
So, what indicators can we look at to determine whether big players anticipate tightening market conditions or not? US treasuries and corporate bonds are the gold standard in this sense. So, when we want to see whether anything is changing in the attitude of whales (not crypto whales, real market whales) we go looking for the yields of US treasuries. In fact, when whales foresee a liquidity crunch, they expect much higher returns on their capital, therefore the interest rate of treasuries goes up. When whales foresee that there will be plenty of liquidity in the markets then dynamics change, there is competition over who lends the money at the lowest interest rates and therefore treasuries go down.
If we look at 10YUS treasuries, after spiking to 1.7% in May, yields have kept going down and are currently at a 2-month low of 1.46%. Therefore, treasuries suggest the markets are risk on (which is good for crypto).
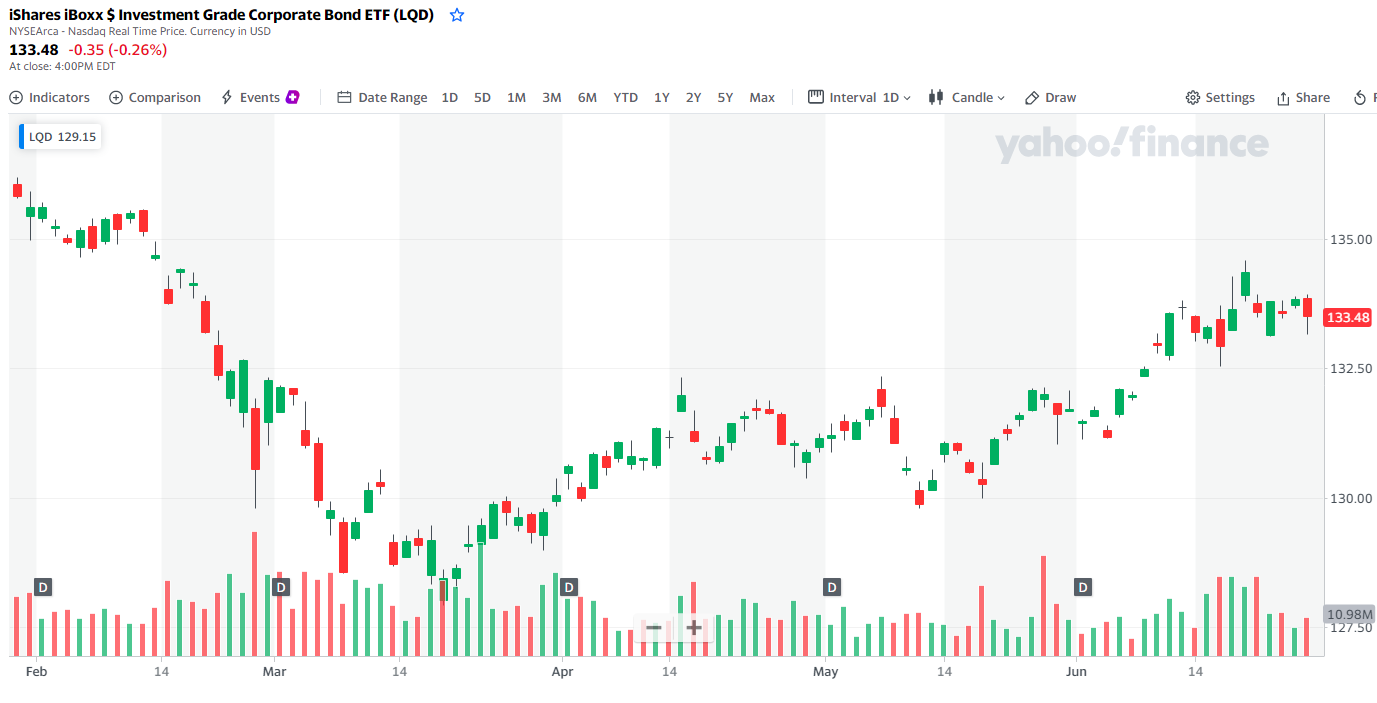
The next thing I look at are low risk corporate bonds, similar to treasuries where people lend money to the US Government, with low risk Corporate bonds people lend money to big, blue chip corporations that have a solid track record and are perceived as being in low risk of default. For them we can check the above price chart, as we can see prices of low risk corporate bond ETFs have been moving in a rising channel since March 2021. Beware that here we are checking the price chart, which moves in the opposite direction of the interest rate of the underlying bonds. Here too we have a confirmation that markets are still in risk on mode, meaning there is no shortage of liquidity.
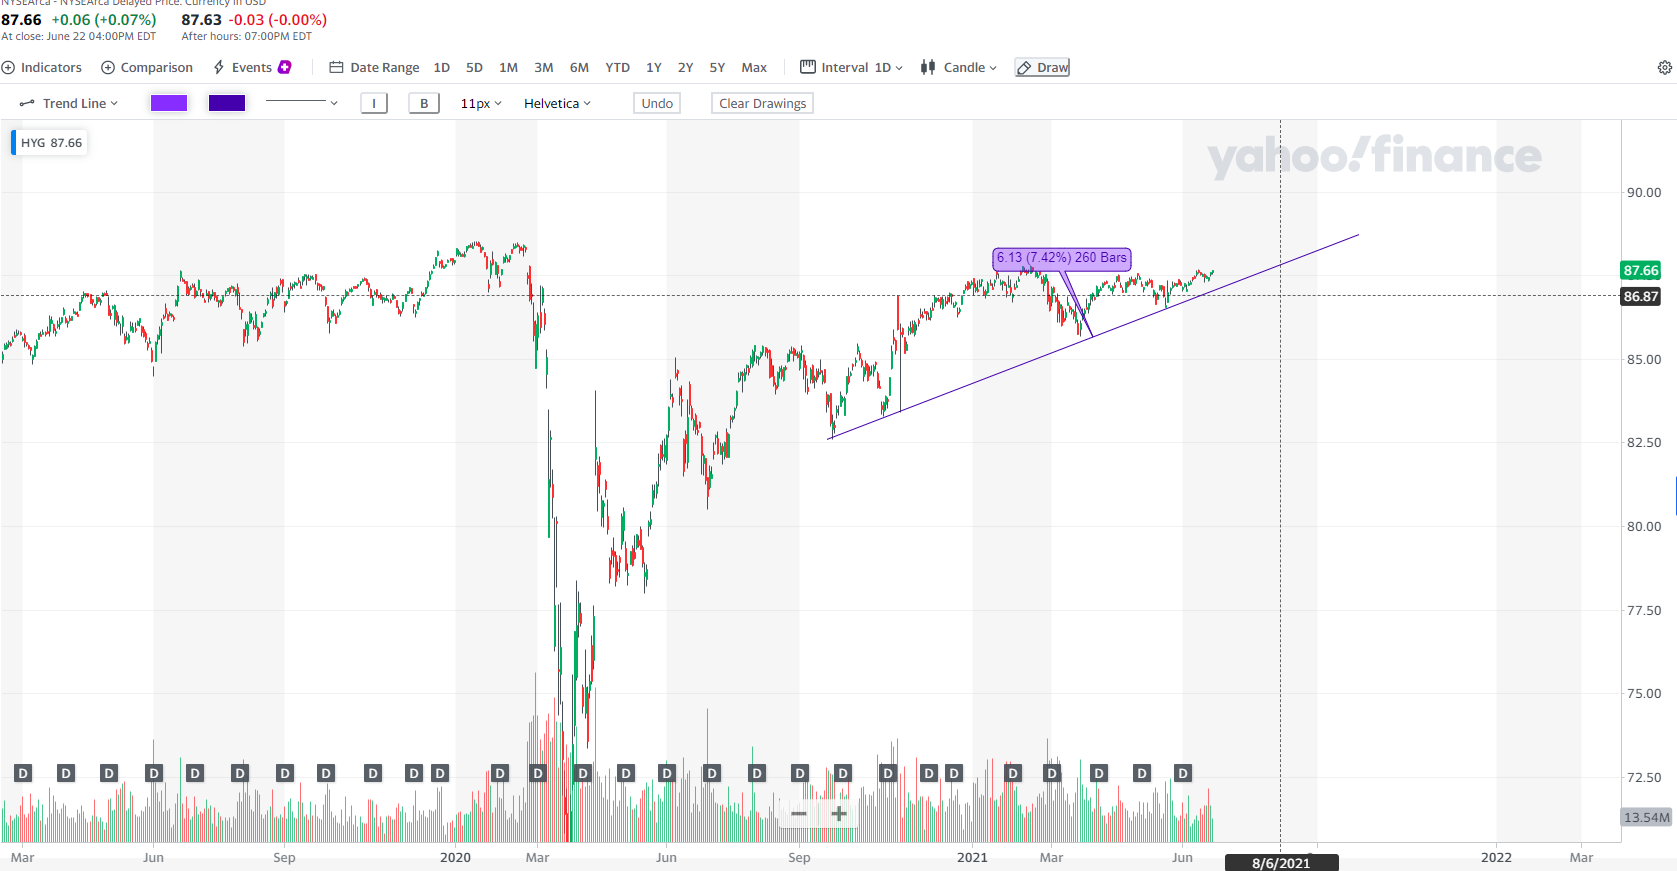
The third indicator is the price of high-risk corporate bonds, these are inversely proportional with the interest rates at which the market is willing to lend money to corporates that are perceived as being at high risk of default. In other words, this is a direct measure of the risk appetite of smart market or legacy market whales. By looking at the above chart here too we see that prices are in strong uptrend, meaning that markets are lending money to these high risk borrower at increasingly lower rates. This is our third indicator that confirms how smart money, which isn't influenced by short term news cycles and media narratives, is risk on.
To conclude, in this first part of the analysis, we can see how in our desert nobody is pulling water out of the desert pool, therefore the wider market gradient favors a bullish crypto market as there is no liquidity shortage. Now let's look at crypto indicators.
Crypto indicators
For this I rely main on Glassnode onchain data analysis. The most interesting chart in this sense is the following, that shows how the amount of coins bought at the beginning of this bull cycle is still maturing. In other words, this shows how holders did sell something at the peak area, but they have kept most of their assets with unflinching conviction regardless of volatility. This implies that these investors do not consider the current cycle closed, and therefore are waiting for even higher highs to sell.

The second indicator has a somewhat mixed meaning. In fact, if look at long term holders, we see that they are accumulating again. This is bearish short term, because when long term holder accumulate, they create downward pressure on price since they patiently wait for retail or short term holder to sell at market. However, something else is going on in the hidden OTC markets, where big amounts of coins are traded, because miners probably affected by the recent clampdown in mining in China, are fueling distribution. We're therefore in a distribution phase in the OTC markets. Below is a glassnode chart illustrating this. This distribution however does not affect market prices because it is hidden, being OTC.

Finally, the recent China ban of bitcoin mining has brought the hashrate to the level of June-September 2020. Negative hashrate momentum means less coins mined and also less selling pressure. While the effects of this are limited in the short term, it is likely that if this trend continues the amount of minted coins may reach an all time low which may then trigger the next cycle to the upside. Again, here the timing seems to be around fall 2021.
Conclusion
I believe that after almost a year of up only what we are going through now is a healthy market correction. Considering the wider market context, the pieces are in place for this crypto bullish cycle to resume/continue later this year once the stars re-align. These include accumulation by whales (which is already at Jan 2021 levels), as well as other catalysts such as decreasing hashrate due to the China ban.
If my article is helpful to you or you are interested, please send me a "LIKE👍"!
Feel free to leave your comments!
Thank you.
The Fountains:
Free Zcash & Dogecoin directly send to your wallet(Binance/Coinbase)
FreeBitcoins website working since 2016
Resource:
Hope it help you guys...