How I see This Bear Market Playing Out - Key Levels To Watch

Best To Zoom Out
I know that many are rather optimistic and believe that BTC bottomed at $25K and is now busy making a comeback. Even though this is what we would all love to hear, it is highly unlikely. Let’s just clarify though that anything can always happen. Trading relies on probabilities, it’s reactionary in nature. In other words, when A happens then respond with B. It’s a journey that gives you direction along the path. However, journeys tend to be rather similar and this is where technical analysis comes in and aids traders and investors in making strategic decisions. Consider that there will now be multiple narratives being shared at this point and unless you do your own research, you will find yourself beginning to doubt and subsequently become confused. Once doubt kicks in investors make foolish moves because they have no objective. It is better to be wrong, reconsider and adjust than to be swinging between bullish and bearish on a daily and weekly basis. That being said, let’s get into how I see this bear market playing out.
A Week Ago
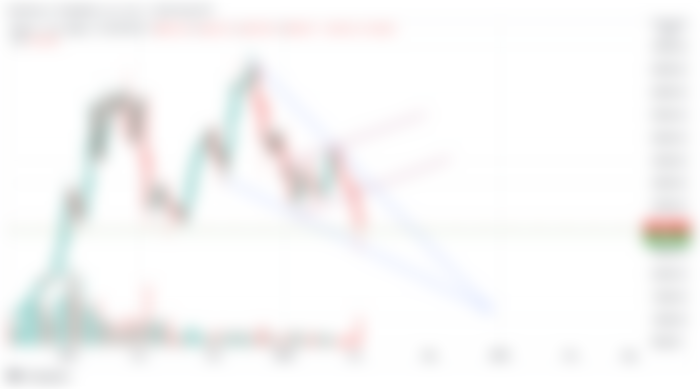
On the 13th of May, I posted an article entitled, “My Strategic Approach To The Current Crypto Market”. I am glad to say that my approach and viewpoint are still intact and have not changed. Further research has only served to further confirm my initial viewpoint. Let’s look at the graph that was key in this particular article.

Image Source – Tradingview.com
As you can see, BTC is trapped inside a massive falling wedge. As mentioned in the original post, BTC does not necessarily need to drop all the way to the bottom of the wedge. These patterns tend to break somewhat earlier and seldom make use of the entire “scope” of the formation. Taking a further look at the charts has managed to generate a bit more clarity in terms of potential price levels. As mentioned, Bitcoin is bearish until it breaks above the wedge, which is currently $40K. This level will drop as time passes.
Zooming Further Out
You have to look at long-term trends. If you are trading, it’s all good and fair to be watching what is happening on a daily basis. However, many are buying this current market as hodlers. They see green and consider it a good buy because it is heavily discounted to prices a month ago. This is not financial advice but rather information that could serve to encourage your own research and perhaps seek investment advice. Prices are more likely to edge lower, even though they may push higher in the short term. I have plotted some key levels to watch on the monthly chart, so let’s take a closer look.

Image Source – Tradingview.com
The market is clearly in a downtrend. What transpires on a daily or weekly basis means very little against the underlying long-term trend. Looking at the current BTC price action the monthly chart reveals how it is in a similar channel to the bear market of 2018. Extrapolation puts my bottom prediction at approximately $18K to $19K. The red arrow points to my expected bottom as well as the 2019 bottom. The blue arrow points to where BTC broke out of the price-locked channel and began its journey upwards. Similarly, I would be waiting for BTC to break out from its current channel.
Where Is That Expected To Be?
The two horizontal green lines reveal expected breakout levels. If BTC were able to muscle a move up to $38K in the immediate short-term then $40K would be a possible exit. However, I don’t think that will happen. I have merely mentioned this for those who think a move to $34K or even $36K is bullish. In other words, that’s the level needed to become bullish. Back to the matter at hand, I would expect the breakout level to be somewhere around the lower green line, which is approximately $23.8.K.
A Bottom Requires A Breakout
One can always risk buying a potential bottom but it is best to wait for confirmation because it can go lower. Looking at the previous 2019 bottom, investors could have bought the $3.1K level or waited for the breakout confirmation at approximately $5K.
Conclusion
So, a lot can still happen in the following months but as it stands, I am looking to watch the following key levels. I am expecting a bottom at approximately $18K to $19K and would expect a breakout somewhere around the $23K to $24K level. A breakout could trigger lower if the price action is very tight and takes slightly longer to play out. These are simply my views and interpretation at this point in the journey. Do not consider this investment advice in any way! All the best!
Disclaimer
First of all, I am not a financial advisor. All information provided on this website is strictly my own opinion and not financial advice. I do make use of affiliate links. Purchasing or interacting with any third-party company could result in me receiving a commission. In some instances, utilizing an affiliate link can also result in a bonus or discount.

5 Passive BTC Generators - Set & Forget
This article was first published on Sapphire Crypto.
Comprehensive list of referral links for platforms & opportunities I utilize to generate daily Crypto income.


I’m making over $17k a month working part time. I kept hearing other people tell me how much money they can make online so I decided to look into it. Well, it was all true. This is where i started… http://workbz.com