Inflation on TFSC Chain

Inflation
Terminology interpretation:
Specific terms will exist in the discourse of transformers inflation, first to illustrate the relevant defined terms, and try to remove the learning confusion caused by the terminology.
Total supply of the TTOS: The sum of the generated and planned inflation segments of the founding block, The total supply of TTOS cannot be estimated, as the trade inflation.
Total circulation supply of the TTOS: According to time, add 70,000,000 TTOS in the initial block to TTOS with inflation output, and minus the TTOS destroyed by destructive events.Inflation time cycle: Transformers go in time by year, from the highest inflation value designed, it will gradually shrink by 12% of the maximum initial inflation rate annually until the stability is a long-term inflation value.
Inflation rate: the annual growth rate of TTOS under the current total supply, which will vary depending on the time and the total stake, values will differentiate at any point in time, to meet the liquidity requirements of the TTOS. For every 1% increase in the total stake, the inflation rate will reduce the initial inflation rate by 1.35% until inflation stabilizes in the long term.
Stake total amount: The total number of TTOS locks for all trustors in the transformers network.
Stake rate: The proportion of the total stake of all verifiers in the current network to the current total current supply.
Stake yield: The return earned during TTOS in transformers network, we may interpret it as an interest on bank deposit; it is calculated in years, assume Valfier stake 1000 TTOS, the annual yield on stake is constant at 20%. You will receive 1000 20%=200 TTOS within one year of the staking period.
The trustors can obtain the TTOS generated by the TTOS by staking a certain amount of TTOS. Suppose the node you are staking keeps working properly and meets the workload requirements of the network in the process of constantly changing inflation and stake rates and time, the stake yield of the current network can be calculated most simply:
Current stake yield%=(current inflation rate% ÷ current stake rate%)×100%
Transformers’ economic change indicators: The transformer’s inflation rate has many factors to consider, we need to design an initially reasonable numerical value for it. That is, meet the kinetic energy needed to stimulate the network construction, meanwhile, needs a reasonable estimate of the additional share for the next 15 or 20 years.
The initial setpoint for inflation needs to make the trustors and verifiers more interested in the network and can be stable and long-term survival in the network. As time progressed, the network will enter a steady state. The requirement for sustained momentum will be gradually reduced, then with time, the transformations inflation rate will gradually shrink to a long-term stable value.
We predict that the demand for TTOS will gradually increase along with ecological development, with the increasing stake ratio, the market demand will be an imbalance and needs to release a certain share of the stake to meet the market liquidity, then the inflation rate should be gradually reduced to the long-term stable values. So, the inflation rate of transformers will be determined by the time period and the stake rate, So, based on the above considerations and sampling calculation, we will determine four indicators.
Initial inflation rate:7.7%
Time deflation ratio:-12%(The initial inflation decreases by 12% a year)
Stake deflation ratio:-1.35%(Inflation reduces 1.35% of the initial inflation for every 1% increase.)
Long-term inflation rate:2%
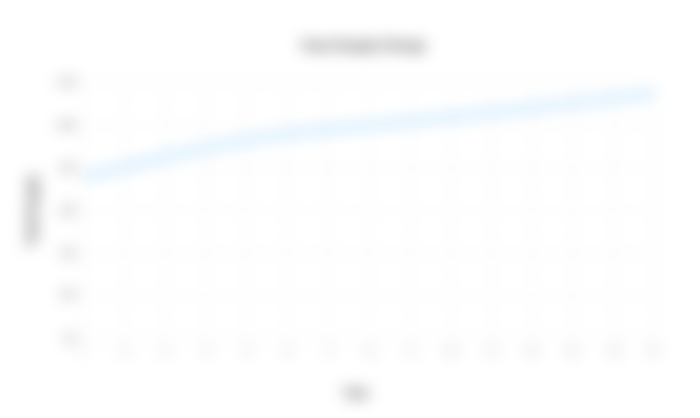
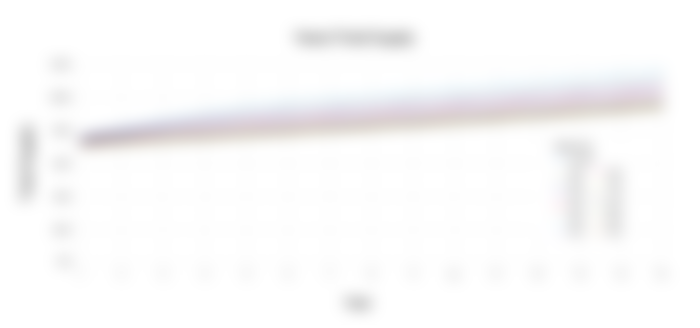
First of all, without regard to the other factors, listing the changes in the supply of transformers inflation rates over time(year). From the initial inflation, the change curve of TTOS's total circulation after the issuance of the planned time cycle, please note that what is shown here will be the largest share of the additional TTOS releases.
Transformers during the time cycle, assuming that the influence of stake rate on the inflation rate, the change curve for the maximum inflation rate by time is as follows:
The inflation rate of transactions will be affected by the time cycle and the stake rate, it takes some time for the total stake to rise at the initial start of the network, due to the interaction between the various economic parameters, if the calculation of the inflation rate changes from the stake rate, it will lead to a sharp rise in the early stake yield, early network participants will receive a vast amount of TTOS tokens, this is detrimental for later progression, therefore, the transformers stake rate is within the 0%-35%change range, the inflation rate is not affected by changes in the stake rate, the affected calculation range of the inflation rate is the stake rate of 35%-90%.
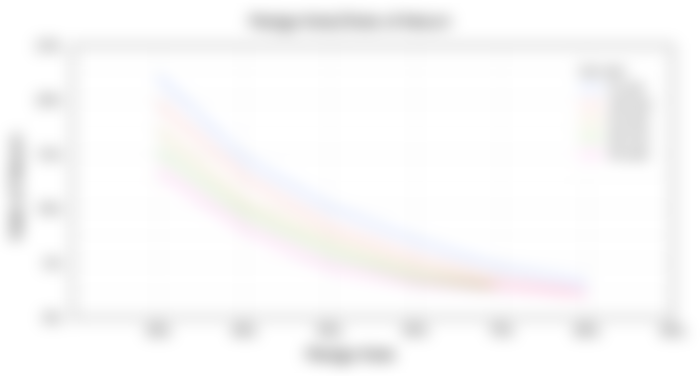
The following figure shows the change in inflation rate in the process of stake rate change in each fixed period. Please note that the stake rate in the chart is a fixed-value sampling, and the actual change range of the stake rate is 35%-90%. Every 1% increase in the stake rate shrinks the initial inflation rate by 1.35%.
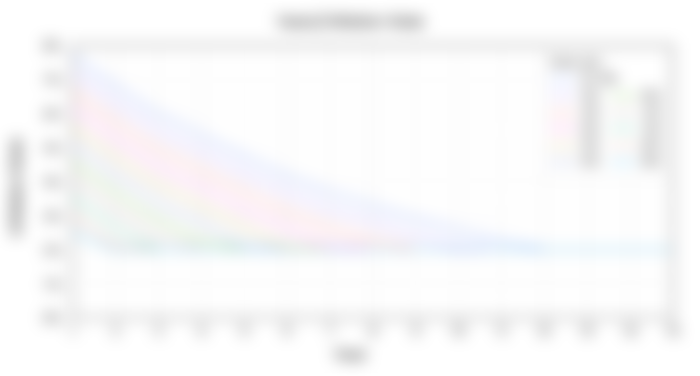

The following figure shows the change chart of the inflation rate under the same action of the period and stake rate. Time cycles are from the first year to the fifteenth year(stake rate is fixed value sampling).
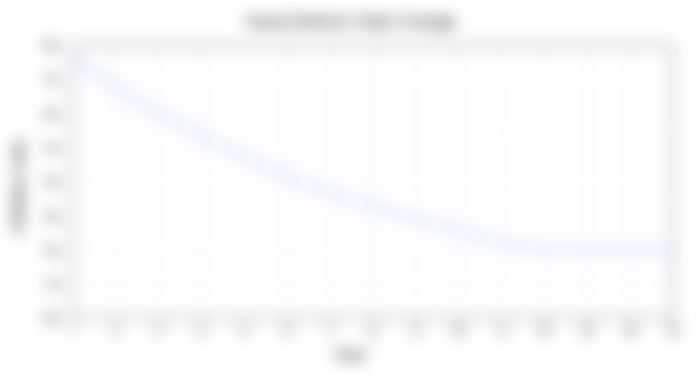
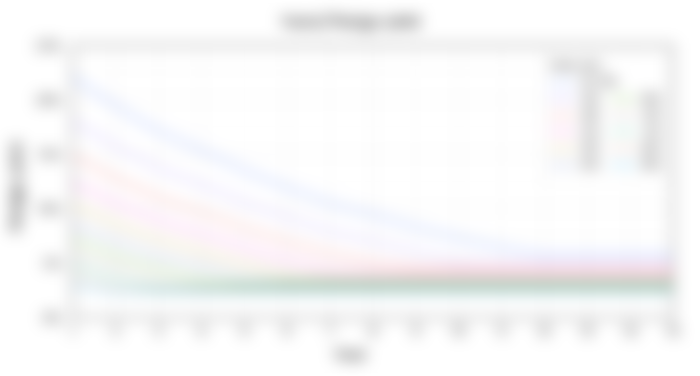
The following figure illustrates the change chart of TTOS total circulation supply under the combined action inflation rate, changes arising from the destruction event and the destruction agreement are not considered.

The economic indicators of the verification of the stake yield in the transformers network are presented below. Firstly, the factors affecting the yield of stake are the inflation rate, stake rate, and verifier workload compliance rate, the functional relationship between them is as follows:
Stake yield TTOS%= (Inflation%÷stake rate % ) × validator workload compliance rate%
The workload index of the Transformers network validators adopts the quartile anomaly number algorithm: Q3=3* (n+1)/4. The validators that meet Q3 are calculated as a 100% compliance rate, while those lower than Q3 are regarded as abnormal validators and will not be rewarded.
The following figure shows the stake yield chart under the condition of 100% workload compliance rate changing with time cycle and stake rate. The stake rate is a constant value sample in the chart, and the actual change range is 35%-90%.

The above content is all the economic indicators that the transformers validator needs to focus on in the network. The relevant chart is also shown and tries to fully understand the relevant economic data of TTOS through the above content authenticator, which is better handle the economic problem encountered by the authenticator for participation in the network process and obtaining the inflationary incentives generated in the transformers network interaction behaviour.