Structure of a Candlestick
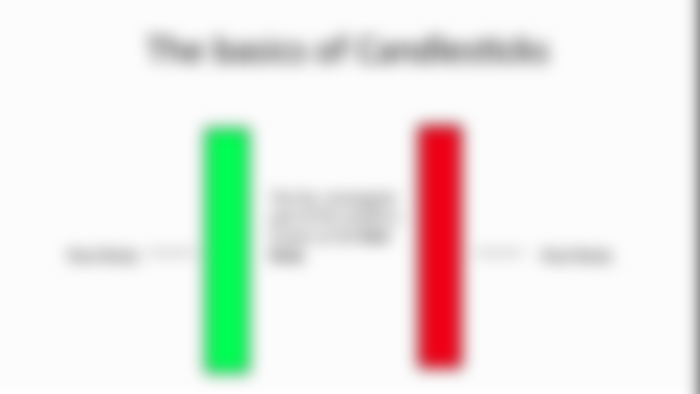
Candlesticks are price charts that display low, high, opening and closing of financial securities over a given duration of time. Candlesticks originated in Japan and were initially used by merchants and trade. Candlestick later got popularized in the USA. Candlesticks illustrate with more claritythe closing price; incase it was either lower of higher than the opening market price of a given token. Note that black/red colors on the candlestick are used to indicate lower while white/green indicate higher price/price gains.
Candlesticks implements technical analysis between various test points to help investors determine when to execute or exit a trade. These trading info-graphs are necessary while trading any financial asset such as stock, foreign exchange and futures.
Candlestick Charts
Candlestick charts were developed by a Muhehisa Homma, a Japanese. Homma discovered that supply and demand of rice is related to the emotions of traders. This would later form his basis of how responsive, emotional decisions affected pricing of stocks from rice enterprises. Hence, Homa came up with candlestick charts to help in analyzing pricing of securities
The Benefit of Candlesticks Over Bar Chart And Line Charts
Most people prefer Candlestick charts because they are more detailed and clear. Furthermore, these charts are more appealing than bar charts and line charts due to the visual color coding of the price bar. The candlestick chart provides you with a chance to select candlestick time been a minute, five or more minutes or even a day. The name of the charts is derived from the candlesticks which highlights the variation between opening and closing of a trading price. Candlestick charts are embedded with candlesticks which represents a number of completed trades with their results; unlike neither the bar chart nor the line chart.
Uses of Candlestick Chart
Candlesticks charts helps the trade to predict the possible movement of price by use of the future pattern motion. Candlestick charts help to indicate the price points (open, close, low or high) in the period which the trader specifies. Clarifying on the market emotional response for a given security or future during a given time.
How to Use the Candlestick Charts?
Select the number of trade that you want to take place before a new candle is formed(tick). the number of traders is usually 466,233, and 512. However, the tick is not affected by any of these numbers. With a trade; tick is only affected by the number of your trade that you select.
Candlestick chart helps you to select time frame; during you time frame you can be in apposition to see each candle indicating high, low, open and close price of you time frame. Moreover, it will show you the movement of the price during that period you had selected.
How to read candlestick charts?
Open price
Open price is shown by the bottom or top of a candle. The candle is green or white and the open price is at the bottom if price trends up. Candlestick is red or black and the open price is at the top when the trend is going down.
High price
Candlestick indicates high price by a tail above the body or the top of the shadow. In case of open or close was the highest hence no tail above the body.
Low price
Candlestick indicates low price by the bottom of the shadow or the tail begin below the body. However, if open or close is the lowest then no tall or shadow below the body.
Closing Price
Closing price is indicated either top (green or white candle) or bottom (of a red or black candle. The candle is formed after the time frame is done. The candle is formed depending on the close price.
Price Direction
You can view the direction of price within your time frame. If its green the price is above where it opened. If the color is red the price is below where it opened.
Range Price
Range price is the difference between upper shadow and lower shadow and is referred to as the range. The range is obtained by subtracting the low price from the high price.
Interpreting Patterns
The candlesticks provide you with a free demo to uses. You can open a trading demo account and play with the candlesticks. You can set the select the time frame and see how it operates. Observer the candlestick pattern.