Trading is an activity in which investors try to make a profit from the purchase and sale of different assets that are characterised by high liquidity, such as stocks, bonds, derivatives, futures, commodities and cryptocurrencies.
Before I start, I would like to tell you that I identify myself as a swing trader, although I sometimes practice scalping. I believe that clarifying what my trading preferences are will help to clarify the approach I will take to my task.
1 - Explain what is the meaning of the green and red candlestick and how to read the green and red candlestick image with candles
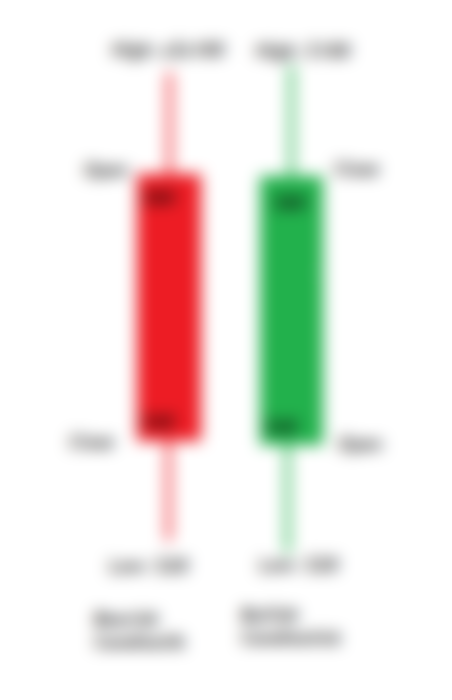
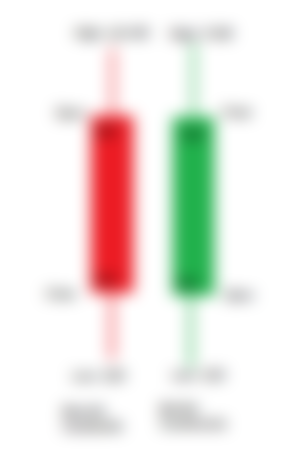
The red candlestick indicates that the price of the currency opened at $80, closed at $40, had a high of $100 and a low of $20. This candlestick indicates a downtrend, as the closing price is lower than the opening price.
The Green candlestick indicates that the price for the selected timeframe opened at $40, and closed at $80. However, it had a low of $20 and a high of $100.
Clearly this candle marks an uptrend because it closed at a higher price than the opening price for the time frame we are working with.
The candlesticks give us very important information about the price behaviour of an asset for the time frame we are working on.
2 - Explain with the candlestick chart, what are the available time frames we can set on the chart and why is it necessary to change the time frame of the candlesticks? (Screenshot needed)
If we go to Tradinview and choose some cryptocurrency we can see that for the same asset we can set different timeframes, from 1 sec to 1 month.
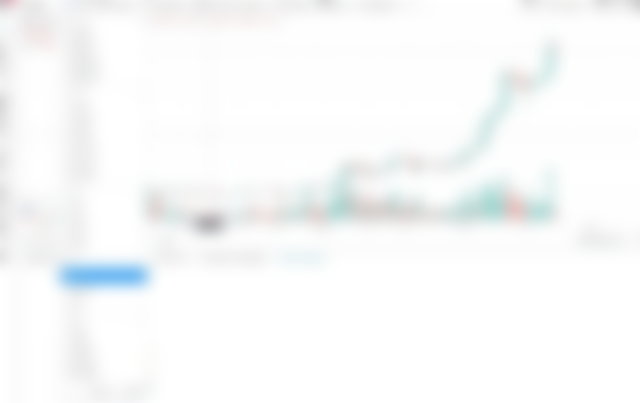

For each of these timeframes we can see the behaviour of the price in the graph of each of the candlesticks, i.e., how much it opened, how much it closed and what were its high and low points.
In this case to show the evolution of the timeframes I chose the ADA currency, as it seems to me one of the projects with the greatest future in the blockchain world.

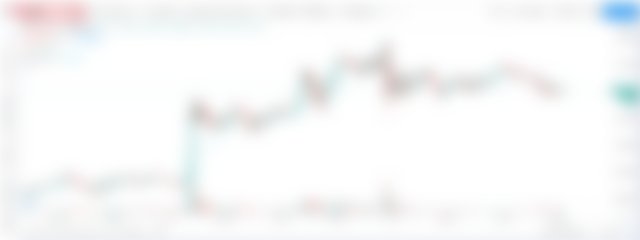


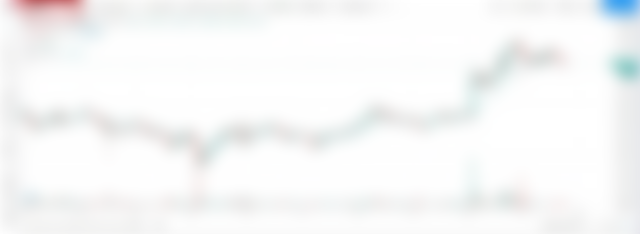


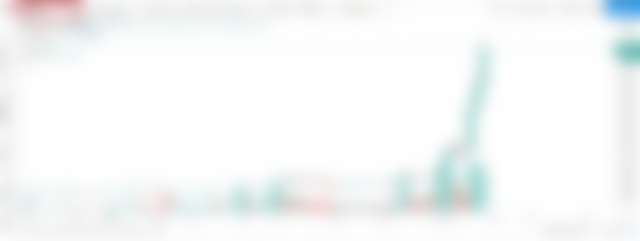

In the graphs of the different time periods we can see that depending on the time period analysed, the trend is different.
I usually do a 1 day timeframe analysis to see the general trend and then I start to analyse smaller timeframes such as 4 hours, 1 hour, 30 minutes and 5 minutes. I usually include the EMA(20) in my charts to know which point to look for in case of a rise or fall.
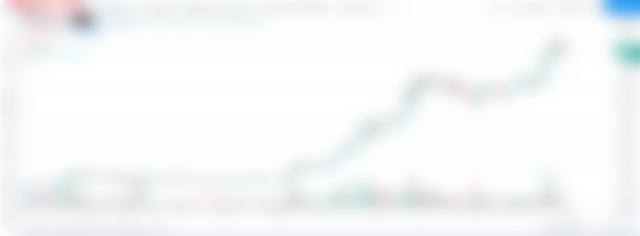
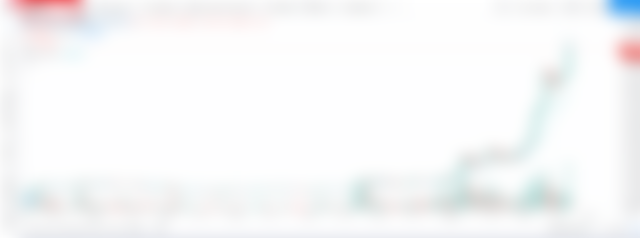
In the charts of the different time frames we can see how the lower time frames show a more sideways trend and as we go up in the time frames the trend is clearly bullish.
The chart of the time frame to use will depend on the type of trading we decide to do or the type of trader we are. If we are short term traders we will probably use 5, 15, 30 minutes time frames.
If we are long term traders we will probably use charts with 1 day or weekly candlesticks.
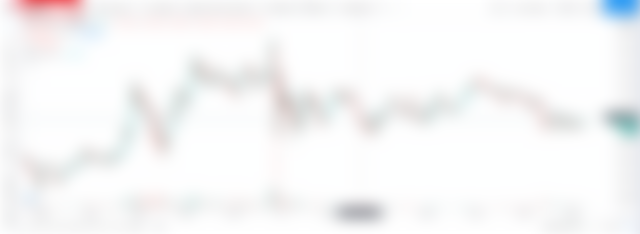
3 - Show any particular asset candlestick chart on a different time frame and briefly explain what you see on the chart, such as what trend we see, what the price levels are. (Screenshot required)
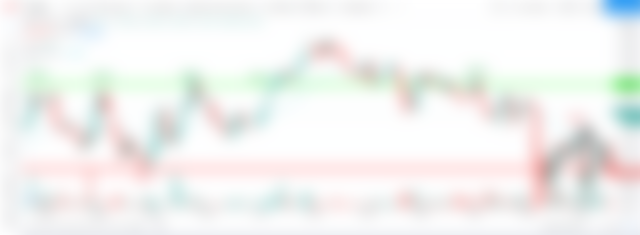

The chart shows that prices oscillate mostly in the range set between support (red line) and resistance (green line). When the price is falling and contact is made with support that marks a buy point.
When the price of the asset is rising and makes contact with support it is a sell confirmation.
It is important to mark at least 5/6 horizontal lines to be able to do a more precise job and above all to be able to visualise when a resistance becomes a support in an uptrend and when a support becomes a resistance in a downtrend.
4 - What types of traders are available in the market and how do they work?
We have 4 types of traders:
Intraday trading
Here we have two types of strategies: Scalping and intraday swing trading, which although it closes positions on the same day usually takes a little longer (5 minutes to 2 hours) than scalping.
This type of traders make their trades during the day. Scalping consists of opening and closing trades in a few minutes, trying to make small amounts of profit numerous times throughout the day.
Scalpers require a lot of technical knowledge and it is a risky and aggressive technique.
Day Trader
Daytrading is similar to scalping in that the trades are made on the same day, but the trades are not closed within minutes, but take two hours before closing the sale. This type of trading is used by traders who do not want to wait until the next day to know the result of their trades.
Traders who apply this type of trading are not characterised by patience and therefore bet on closing their positions on the same day.
Swing Trading
This is medium-term trading, with several days passing between opening and closing a position. This strategy is for more patient and disciplined investors and requires the patience and confidence of traders to hold positions if there is a temporary drop in prices.
Several weeks may elapse between buying and selling.
Position trading
Here trades can remain open for several months. Traders require a great deal of patience, a great deal of knowledge of the market and a great deal of technical and fundamental analysis.
It is also very important to know how to discriminate the information that is going around in the ecosystem, nor should you be very influenced by other traders.
Here the analysis is done by the trader himself and he trusts his work. This is a long-term job.
Now knowing this we are in conditions to decide what kind of traders we are going to be, taking into account the mentioned characteristics and which of these characteristics we recognise in our personality.
I want to share with you a phrase that I heard a long time ago and it seems to me very clear to try to be a good trader and it goes like this;.....
... "In trading, the patient investors take the money of the impatient ones"....
And this is very true; remember that the financial markets are manipulated by those who have more economic power to manage to keep the money of those who sell their positions when the currency shows only a small drop...
5 - When trading or investing in assets, what is the importance of support and resistance, explain how they work?
The supports and resistances are essential when trading because they are those levels (lines) in which the price of an asset bounces in several opportunities, but they can be crossed.
Supports indicate that when we have a downtrend, the price of the asset goes down to a certain point from which prices start to bounce as if rejecting the price to go lower than those levels. Sometimes prices can break through these supports in such a way that they end up becoming resistance.
The same happens with resistances, when we are facing an uptrend. Prices tend to rise up to a certain level beyond which the market starts to reject them and makes them stay in a more or less stable price range.
Supports and resistances act as a kind of a ceiling that keeps prices in there, but nothing prevents them from being breached and a resistance becomes a support and a support becomes a resistance.
It is important to bear in mind that the supports and resistances marked in higher time frames have more strength than those marked in lower time frames where the supports and resistances are usually more fragile.
THE IMPORTANCE OF THE SUPPORTS AND RESISTANCES IS THAT THEY MARK THE POINTS OF PURCHASE AND SALE RESPECTIVELY WHEN LOWS OR RISES ARE REGISTERED IN THE PRICES OF AN ASSET. IT IS WORTH CLARIFYING THAT THIS IS USED IN FRONT OF OTHER INDICATORS THAT CAN INDICATE THE TENDENCY THAT THE ASSET CAN HAVE.
6 - How can we find support on the candlestick chart, explain with one of the asset candlestick charts with screenshot and point out the levels. (Screenshot needed)
In the charts we can find the supports by looking at the points where when the price of the asset falls to a certain point from which the prices bounce upwards.
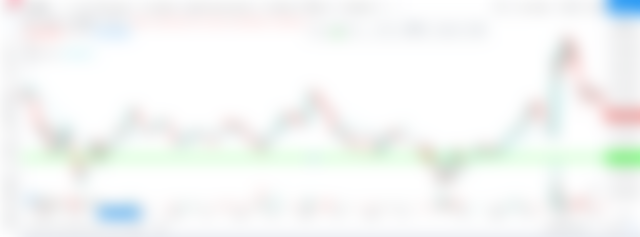

Recall that support is a point at which the price stops its decline and starts to rise again.
It is important to remember two things:
- Supports and resistances are more sources for higher timeframes.
- The more times the price returns on a support or a resistance, the more strength they will have.
7 - After finding support, when and where should we place a buy order? Explain with a screenshot of the chart? (Screenshot needed)
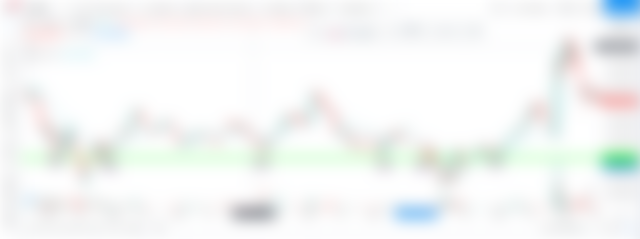

To set buy points we must be vigilant and patient for the price to move down to the point of resistance. Once prices drop to that level we can place our buy order.
The use of support and resistance to place our buy and sell points is vital to successful trading.
Great article! Thanks for publishing this here 😊