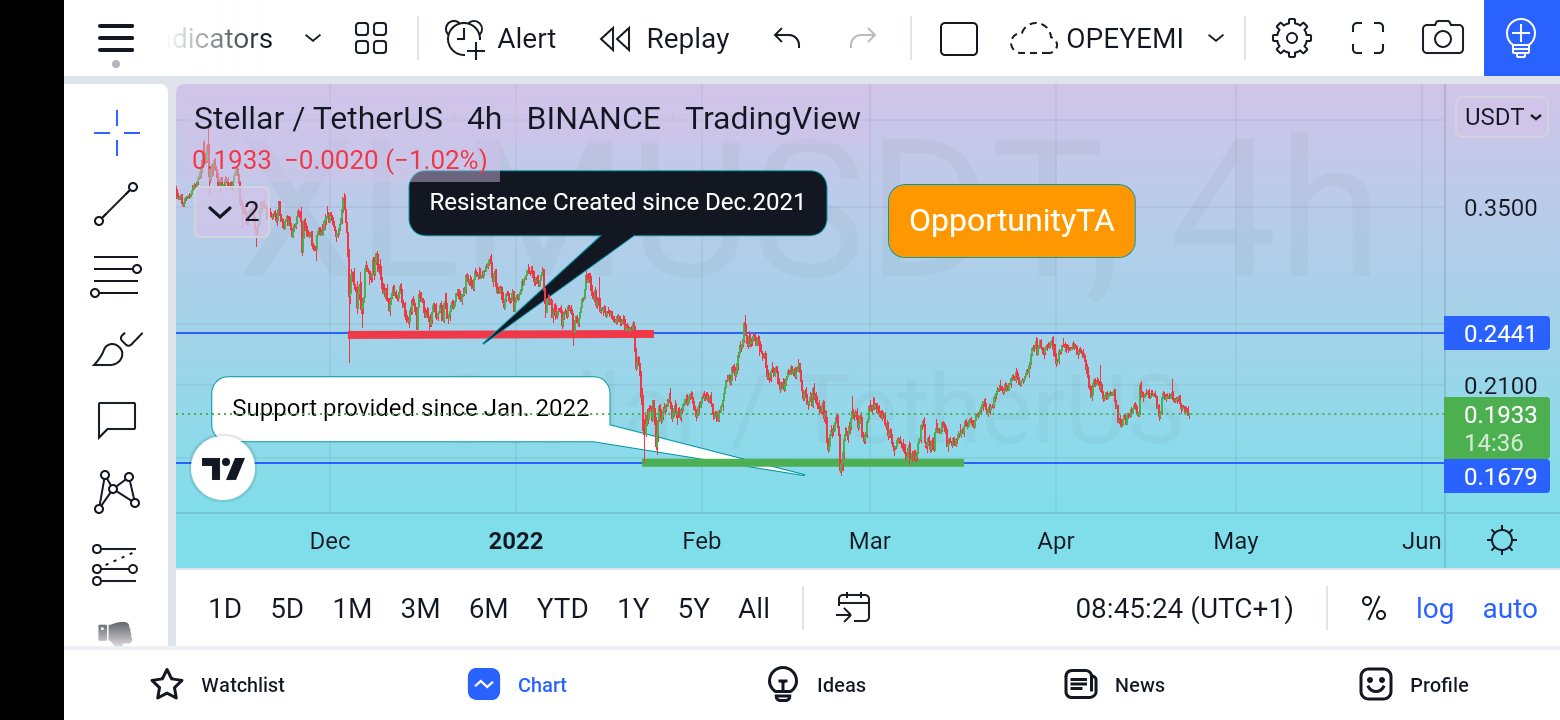
Profitable Trading in the Strength of Support & Resistance


Trading digital assets is profitable provided traders understand the principles of support and resistance and abide with it. There is a saying which goes: buy when price is low and sell when price is high. You can successfully do this if you know how to look for support and resistance otherwise you will be doing the opposite of the saying above.
Looking at above image, you will see the line acting as resistance and another line standing as price support with dates right from when both support and resistance started. The idea is this: if the support is broken, it shall be flipped to resistance and price shall fall further, providing an opportunity to buy more at cheap price. Traders should not be afraid of buying more since they have already done their first assignment in dealing with a coin with good future potentials.
On the other hand, if the resistance is broken, the resistance shall turn to support. The coin in question will then rise in price, some other traders will be encouraged to buy hoping for profits (this will further increase the price), those who bought at the support can sell some of the coins and so on.
How to understand where to mark support and resistance is not difficult, just look at those points a coin gets to and move up. To mark resistance, look for where a coin gets to and move downward.
Knowing support and resistance will not only let you buy and sell at the right point only but lead you to another advanced level in technical analysis. As master support and resistance,you get to form patterns and guess what, digital coins move and operate based on patterns. Like in the above image, you can see that both support and resistance are coming together to form a triangle, that is being called triangle pattern in technical analysis. If the triangle is broken upward, the coin will pump and price rises. If broken downward, the coin price shall dump and price falls. Look at the chart below showing us how Doge coin pumps massively by broken up its first bullish triangle. The triangle is simply drawn by carefully ruled out both support and resistance line using weekly timeframe. The red line in the chart (third line of the triangle) is the resistance broken for massive pump from 0.0036$ to 0.6$. That is 16,566% profit just like that. This means if you invested 200$ by buying Doge when resistance was broken and flipped to support, your $200 should then flip to $33,133 that is how profitable it is to trade in the Strength of support and resistance.

It is not safe to say price shall fall or rise but to let the coin speak for itself based on support and resistance with pattern formed.
Please support me through all the means provided on read.cash Thanks for reading through.

