While this is true, price action plus volume can define the direction a cryptocurrency will take based on the movements it has made in the past. However, there are chartist figures that can guide us on this issue, since they are a confirmation of what the price will do, and in this sense, we will analyze what happened with the price of Ethereum.
As you can see from the chart, ETH had a trend reversal after displaying a chart figure known as a double top.
What is the flysheet?
It is a reversal pattern that heralds a potential turn from bullish to bearish trend and we can see it clearly on the chart.
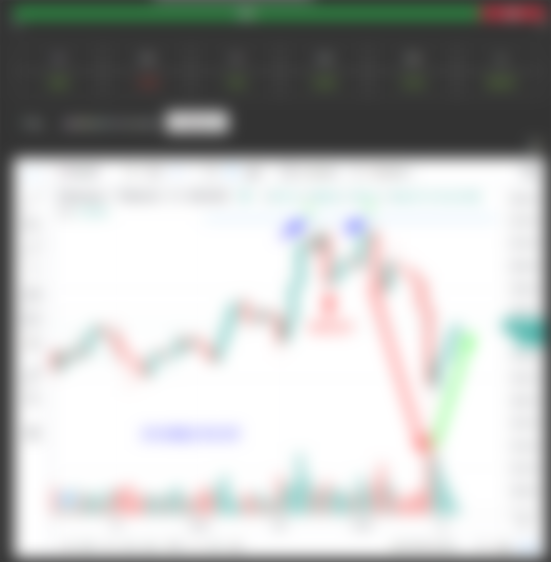

When we see that the price has reached two similar highs consecutively and in the middle a valley, (a lower price) then we are in the presence of a double top that is indicating that the trend will change from bullish to bearish, and this time we can sell to buy again when the uptrend resumes.
A little more than 11% was the fall that the price of ETH had and by the time I make this publication its price has recovered about $ 140 to reach $ 1946.
As I explained in the previous publication, enthusiasm for this coin continues to rise, as many point out that it may reach $ 10,000.
In my case, I continue to keep ETH in my portfolio as I expect this coin to cross the $ 2500 barrier very soon.
As always, I only share my appreciation and what I have learned regarding cryptocurrencies, so this post is not an investment tip but what I have been doing with my money.