DISCLAIMER: I am not a financial advisor.
This is going to be part one of the Chart Analysis. This will mainly contain everything about candlesticks. I also put external links for videos you can watch to fully understand the theory behind the Japanese Candlesticks in the chart.
CHART INDICATORS YOU NEED TO KNOW ABOUT:
CANDLESTICKS
Japanese Candlesticks is one of the basic indicators a newbie trader need to learn to be able to read a chart carefully. It is a concept developed by Munehisa Homma, a Japanese rice merchant, to determine how traders-buyers and sellers, affect the rice value on the market.
Candlestick(s) indicate what the cycle was in a certain period of time. It could be bullish or bearish, depending on the market's influence.
PARTS OF A CANDLESTICK
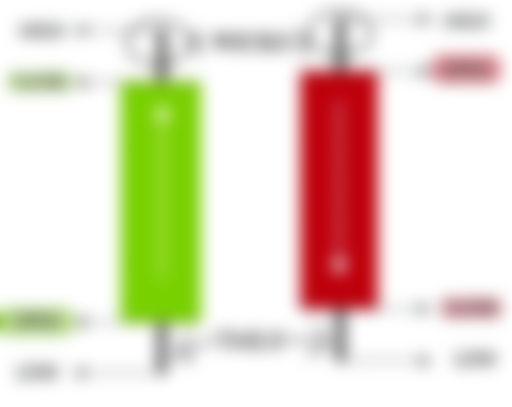
If you can see, in the picture above, there are two types of candlesticks. Now, I previously wrote about the bull/bear market. These candles indicate which of the two has more influence on the present price value of a certain coin.
(Real) Body
The green candle indicates a bullish market/price, whilst the red candle indicates the opposite. It also represents the opening and closing price on that specific timeframe. The longer the candle, be either green or red, the stronger the influence it has over the size of the price move. Likewise, the shorter the candle/body, the weaker the influence.
Wick and Tail/Shadow
The wick shows the highest price set of a candle in a certain timeframe, whilst the tail/shadow shows the lowest price set of a candle in a certain timeframe.
Open/Close
The Opening price is the first price traded during the formation of that candle no matter what the timeframe while the Closing price is the last price traded during the formation of that candle in a certain timeframe.
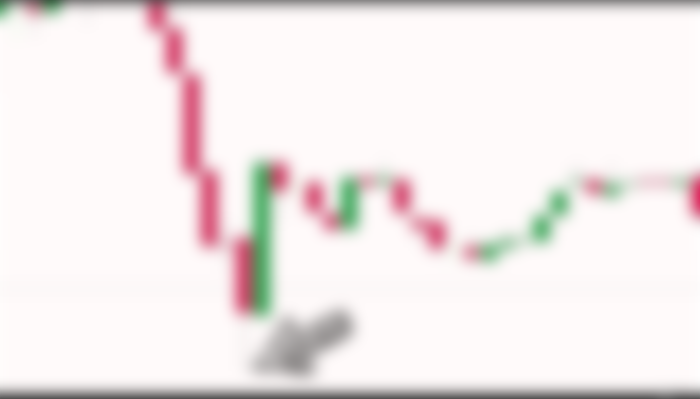
To further demonstrate the wick above is the highest price this bullish candle reached in this specific candle.
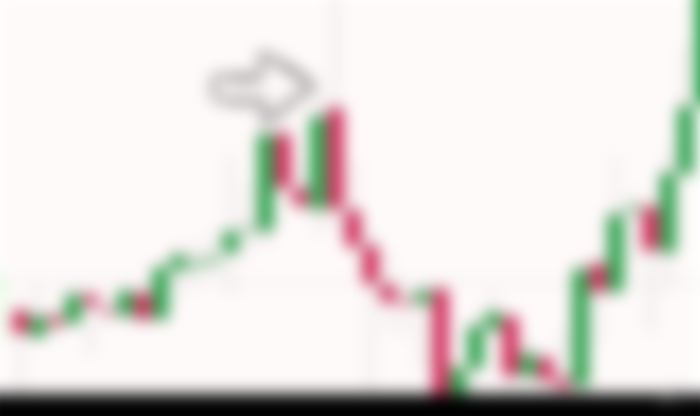

Here is a close up:


The high price is the top of the upper wick, and if there's no wick, then the closing price is the opening price of the next candle-it doesnt matter if it's either a bullish or bearish candle.
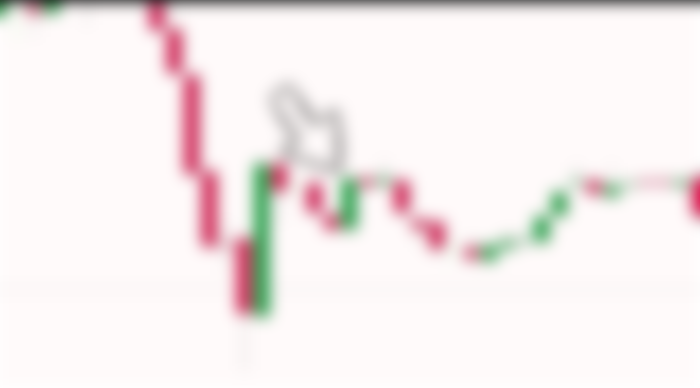
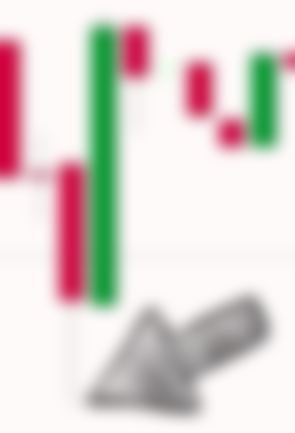
While the low price would be the opposite and is the bottom of the tail/shadow of a bearish candle. Again if there's no wick, the closing price is the opening price of the next candle-no matter whether it's bullish or bearish.
Here is a close-up:

Now that you know all of the basic pieces of information about a candlestick, we can now jump into different candlestick patterns. These patterns can be observed closely in a chart. You can always wait for a reconfirmation if a pattern is bullish or bearish.
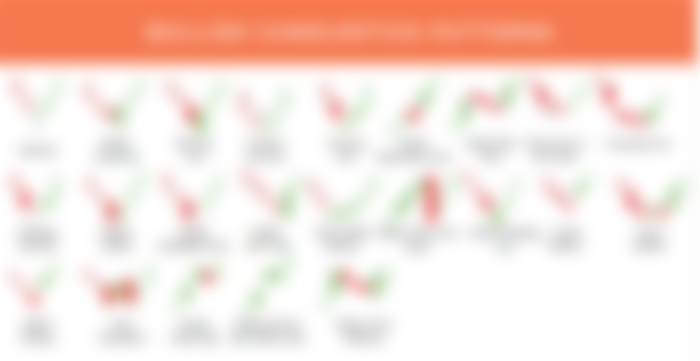
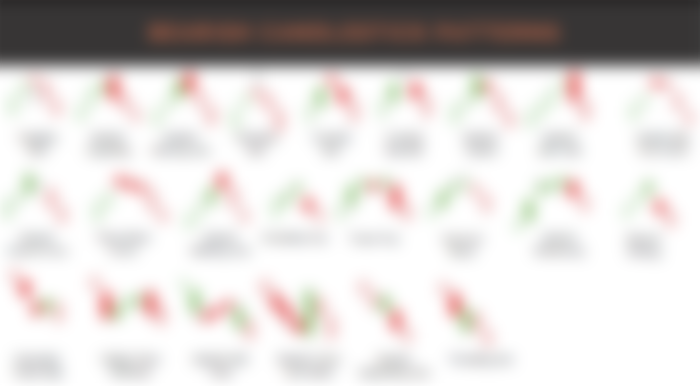
CANDLESTICK PATTERNS
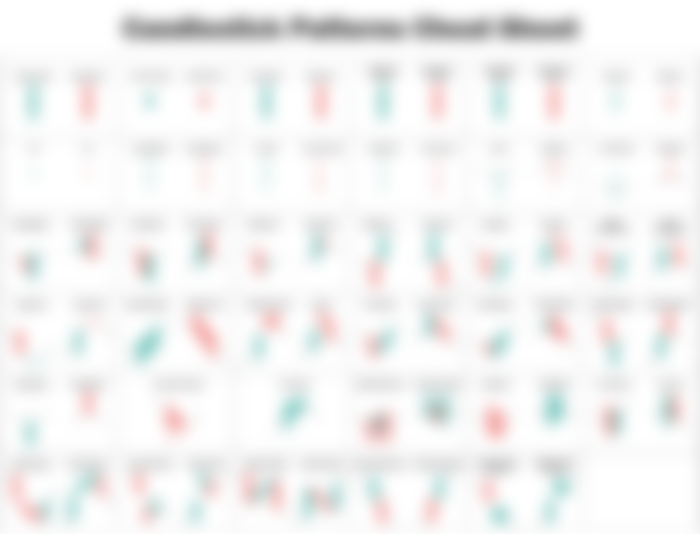
Below is the division between which patterns are bullish, bearish, reversal, or continuation.


To learn more about candlesticks, you can watch the tutorial here on how to read the candlesticks in the chart. You can also download the pdf version of this candlestick cheatsheet here.
Next Lesson: Chart Positioning
Feel free to comment about the content you want to read about. I would gladly write about it :)