

In today’s post we are going to continue taking a look at some technical analysis, this time in the form of the MACD. The Moving Average Convergence/Divergence indicator is a very useful tool when you are trying to gauge the momentum of the market, and can help signal entry points for trades.
For the usual disclosure, I am not a financial advisor, I don’t even work in finance at all. My day job is as a telecommunications software engineer. Treat everything you read here as some educational resources and not financial advise.
What Is The MACD


The MACD is a technical indicator that gives you a good visualization of momentum in price action, as well as a general direction of trend. It is made up of a few different parts that come together to tell you a story.
The MACD Line


The first line on this indicator is the actual MACD line. This is not just a normal exponential moving average, it’s two of them one subtracted from the other. By default, the long period is at 12 periods, and the long period at 26. This means the MACD line itself is the 26 period EMA with the 12 period one subtracted out from it. This helps make it respond faster to changes in prices than a normal exponential moving average would.
The Signal Line


The signal line, by default, is the 9 period exponential moving average of the MACD line. This gives it a smoothed out version that is lagged behind the MACD line. This allows it to react slower to price changes and gives you separation between them which is one of the ways you can determine price momentum from the MACD indicator.
The further part the lines, the faster price is changing. If the MACD line is above the signal line, the price is trending upwards, and if it is below, the price is in a down trend.
The Histogram


The final part of the MACD indicator is the histogram. All this does is give you a visual representation of the distance between the MACD and signal lines. This gives you another good indicator of the price momentum. As the price changes faster, the MACD gets further from the signal line, and the bars of the histogram get larger.
Adding The Indicator
Adding the indicator to our chart is pretty straight forward, we just have to click on our trusty ole indicators button:


And then you just type MACD into the search and click it from the list:


As far as settings, which you can open by double clicking anywhere on the histogram, I would leave everything on the input tab alone, and only change up the colors and thicknesses for the MACD and signal lines, but that is personal preference:


MACD / Signal Crossovers
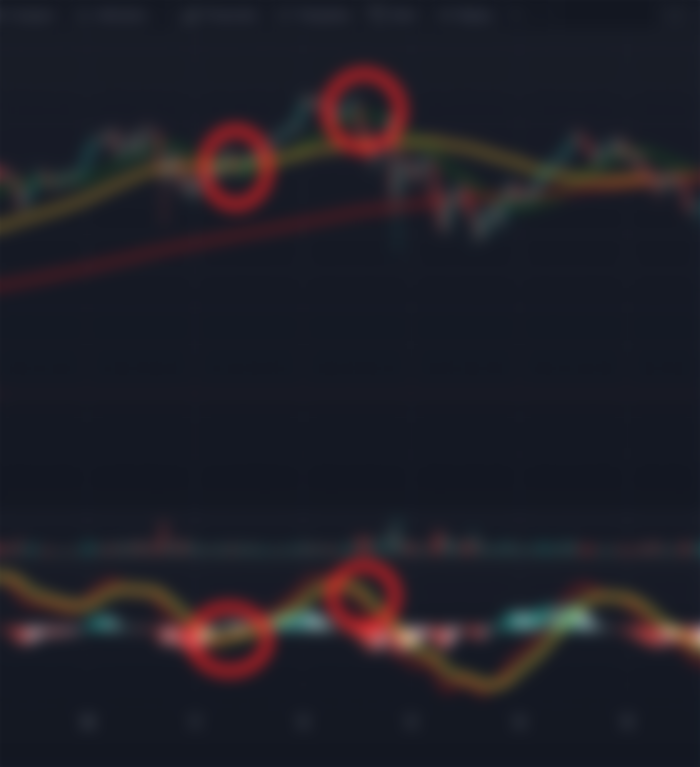
One usage of the MACD indicator is to spot places where price is possibly going to change direction. When the MACD crosses through the signal line, this is generally going to precede the price shifting in that direction. You can see it play out as the momentum in the price push loses its steam and then either hits a pull back, or a complete reversal.
Now, this is not a foolproof indicator, and often times if the market is trading sideways for a period, much like we are currently seeing here at the start of the second week of June 2021, the line is going to crash through the signal line quite often, especially if you are looking at shorter timeframes.
A good rule of thumb is to use the MACD as a confirmation signal for all your other indicators. If the market is trending in the way you want it to, and you see the price candles playing out a pattern you want to use as your entry point, and all your other indicators are giving you the green light, the MACD can be a good final confirmation that it’s time for you to enter your trade.
Conclusion
While on it’s own, the MACD doesn’t really provide you enough details to feel confident blindly following it into trades, when combined with the other indicators and trends, it can help you narrow in on your entry and exit points to help maximize your gains.
Find me on social media on Twitter, Facebook, Instagram and Telegram.
If you enjoyed this content, you can check me out every weekday. My posts start at my website, but you can also find them cross posted at Publish0x, LeoFinancial, Hive, and read.cash.
I also post a weekly price update video every Saturday over on my YouTube channel, where I will be discussing the weekly price action for some of the major cryptos.
Want some more content right now? Check out some of my previous posts:
Smart Contracts: Code Is Law
A Guide To Spot Trading
Blockchain: What’s A Blockchain?
Originally Posted On My Website: https://ninjawingnut.xyz/2021/06/07/macd/