For today’s article, we are going to take a look at a useful technical indicator, the Bollinger bands. These are a useful indicator that can give you a good visual reference to how volatile the price action of an asset it.
For the usual disclosure, I am not a financial advisor, I don’t even work in finance at all. My day job is as a telecommunications software engineer. Treat everything you read here as some educational resources and not financial advise.
What Are Bollinger Bands
The Bollinger bands are a technical indicator that combine a moving average with range indicators that help identify how volatile the price is, and can give you some good indicators on where potential price targets are. They look a little something like this when you add them to your price chart.
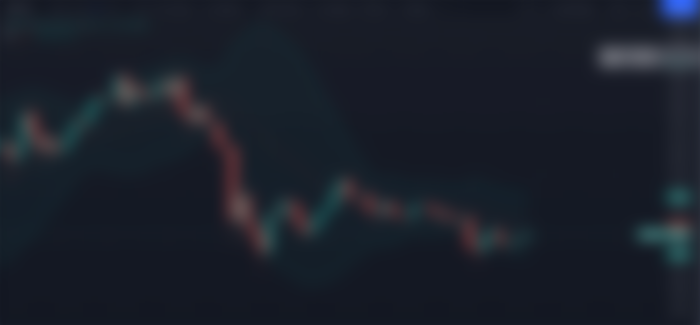
By default, the moving average line is a 20 period one, and the top and bottom of the Bollinger band range is 2 standard deviations off of it. The moving average works like any other, so it is just a smoothed out representation of the price over the last 20 periods. The bands shows you how far off the centerline the price can be expected to deviate based on a deviation formula from the moving average line.
The bands will expand and contract as the price volatility goes up and down. When the price is going more sideways, the bands will restrict down like they do here:
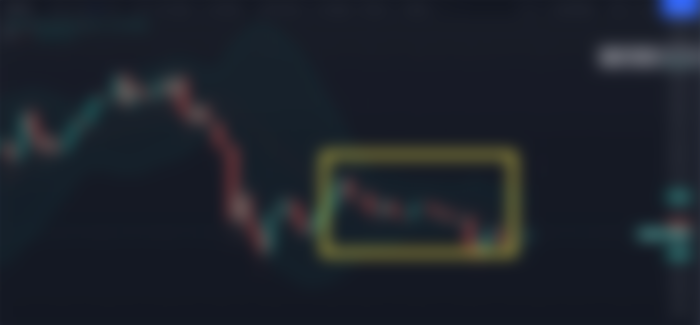
But then as the price starts to get a little more action going, even pushing out of the bands, we can see they start to expand out further. I also modified my chart back to the way I generally look at it, which includes the multiple moving averages.
Here we can see that as the price of Binance Coin (BNB) started to fall rather rapidly and push outside of the bands, they started to expand out from the centerline pretty quickly, expanding the range out quite away. Then after the price starts calming down, we can see how the bands contract back in to the center and we get the price consolidation.
The general saying is that 95% of the price movements should happen within those bands, but I personally feel that is more towards traditional asset trading, because the crypto game seems a little too volatile for that, and I often see the prices getting outside of those bands.
Using Bollinger Bands
Bollinger bands can be used in a lot of ways. The obvious first way is of course to get the visual indication of how volatile the price is at any given time. The wider the bands, the more volatile the price is. You can use this to spot times when the price is consolidating, because those tend to happen before a breakout in either direction, so that could be a good indicator for making an entry into a trade.
The Bollinger bands can also be used to spot when a breakout to either side is happening. Since the bands mark the standard deviation, and are basically soft support and resistance lines, prices pushing above or below them are working outside the expected variance off the moving average, so could be a sign that the market wants to push. That being said, in just the chart above, I can see 2 places that would have worked and 1 where it would not have, and the one it did not, it reversed pretty hard in the opposite direction, so it’s far from perfect for that.
Another way some traders will use the Bollinger bands, specifically people doing much shorter timeframe trading, is to set their buy and sell points around the top and bottom of the range. They are expecting the price to move from the top to the bottom of the range as it moves along it’s overall trend line. I personally don’t buy into this, as I from all the price charts I’ve seen, the price rarely so nicely bounces from the top to bottom, but it is an option some people use.
Conclusion
On their own, the Bollinger bands are just a single moving average with the deviation lines, so generally they should be couple with other indicators to help give you a good overall picture of the price action. They have a lot of uses, but I personally find them most useful for being able to visualize the price volatility, and for spotting points of consolidation where a move may be coming.
Socials And Other Links
Find me on social media on Twitter, Facebook, Instagram, Telegram and noise.cash.
If you enjoyed this content, you can check me out every weekday. My posts start at my website, but you can also find them cross posted at Publish0x, LeoFinancial, Hive, and read.cash.
I also post a weekly price update video every Saturday over on my YouTube channel, where I will be discussing the weekly price action for some of the major cryptos. You can also sign up for my newsletter which I send out every Friday with news and whatnot from the crypto space, delivered right to your inbox!
You can also find links to resources such as research and news sites over at this link.
Want some more content right now? Check out some of my previous posts:
Liquidity Pools
Impermanent Loss
Decentralized Finance (DeFi)
A few referral links, in case you are interested in the service, and it also helps me out.
Binance – large centralized exchange – referral link saves you 10% on trading fees
Coinbase – basic crypto exchange – referral link gets you bonus crypto on first deposit
Cointiply – very good crypto faucet and earning site – no bonus for you on this referral unfortunately
Originally Posted On My Website: https://ninjawingnut.xyz/2021/06/29/bollinger-bands/
good sir you very hard working