In today’s post we are going to take a look at another technical analysis indicator, the Average True Range (ATR). The Average True Range is another good indicator for seeing the momentum of price action, but it can also be very useful for determining where to set a stop loss on a position.
For the usual disclosure, I am not a financial advisor, I don’t even work in finance at all. My day job is as a telecommunications software engineer. Treat everything you read here as some educational resources and not financial advise.
What Is The Average True Range (ATR)
The Average True Range shows you how much the price has changed smoothed over a given period. It works similar to an Exponential Moving Average, with the key difference being that it does not care if the price goes up or down, it only cares about the amount the price changed by.
Like a moving average, this indicator can be a little lagged. By default (at least on TradingView) it’s going to use the previous 14 periods and give you an EMA like line. It doesn’t detect a trend before it happens, but it can be a very useful indicator to confirm things at glance that the price changes are getting more, or less, aggressive over time.
Using The ATR

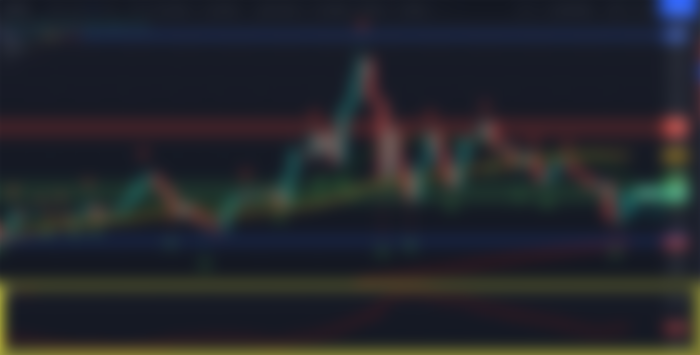
Looking at this current chart for Cardano (ADA), we can see that as the price started moving upwards in the bull charge just before the crash a month ago, that the ATR indicator was starting to move upwards, showing an increased momentum to the price change.
We can also see that during the large movements of the crash, the indicator stayed up, because it didn’t matter that the price had reversed direction, it only mattered that it was still moving by a fairly significant amount across the session.
Looking at the Cardano (ADA) chart again, we can see that after the massive down move from the crash, as the price stabilized and became more sideways, the ATR slowly came back down to about the 16 cents per day range (which for a crypto with a price under $1.50, that’s still a pretty big movement).
In the last few days, as the markets start to become a little more volatile as prices are thrashing around and nobody knows which way they are going to go, the ATR is starting to come back up, up to about $0.1814 cents at the time of writing.
A very common usage of the actual value of the ATR is for determining a stop loss point, which is a major factor when determining how big of a position to open as part of the risk assessment of a trade. Using the current ATR for Cardano (ADA) of just over 18 cents, we can reasonably assume that the price could swing by at least that much and still stay within trend,
Using this knowledge you can take your entry point, factor in the ATR plus a small buffer, and you could determine a stop loss position and then roll that backwards into determining how big a position to open. For example, if we were to make a long entry into Cardano (ADA) at $1.35, we can take the ATR of $0.18, and reasonably guess that the price could drop as low as $1.17 before we would really start to worry.
Add a little buffer and call it $1.15, so that would give us a $0.20 loss per unit, if we were only willing to lose $10 on the trade, that would give us a position size of 500 that we could open on.
Now obviously if you are trading on margin/leverage, the math is not that clear cut, and you really should know what you are doing before going into trades where you are borrowing against your collateral, as you do not want to get inadvertently liquidated because you didn’t understand some aspect of what you were doing.
Conclusion
While a pretty basic indicator on the surface, what the Average True Range (ATR) can tell you as far as momentum and helping to set a position size and figure out reasonable stop loss points, makes it punch far above it’s weight class in the usefulness competition. Being able to take a bunch of up and down candles and just simplify it into a line that can show you how volatile an asset is really behaving, can save you from jumping into something and getting rekt.
Socials And Other Links
Find me on social media on Twitter, Facebook, Instagram, Telegram and noise.cash.
If you enjoyed this content, you can check me out every weekday. My posts start at my website, but you can also find them cross posted at Publish0x, LeoFinancial, Hive, and read.cash.
I also post a weekly price update video every Saturday over on my YouTube channel, where I will be discussing the weekly price action for some of the major cryptos. You can also sign up for my newsletter which I send out every Friday with news and whatnot from the crypto space, delivered right to your inbox!
You can also find links to resources such as research and news sites over at this link.
Want some more content right now? Check out some of my previous posts:
Decentralized Finance (DeFi)
Non Fungible Tokens (NTFs)
Decentralized Autonomous Organizations
Originally Posted On My Website: https://ninjawingnut.xyz/2021/06/24/atr/
