This article is built on the ideas shared in Part 1: The Essentials and Part 2: Understanding candlestick charts.
Make sure to take a look at those 2 articles before moving one because it will help you better understand the following information.
Great! Now that we know what time frames to use, what type of charts, and how to interpret the information from candlesticks, it's time to move forward to two of the most popular concepts related to technical analysis: the level of support and the level of resistance.
These terms are used by traders to refer to price levels on charts that tend to act as barriers, preventing the price of an asset from getting pushed in a certain direction. At first, the explanation and idea behind identifying these levels seem easy, but as you'll find out, support and resistance can come in various forms, and the concept is more difficult to master than it first appears.
Support is a price level where a downtrend can be expected to pause due to a concentration of demand or buying interest. As the price of assets or securities drops, demand for the shares increases, thus forming the support line. Meanwhile, resistance zones arise due to selling interest when prices have increased.
Once an area or "zone" of support or resistance has been identified, those price levels can serve as potential entry or exit points because, as a price reaches a point of support or resistance, it will do one of two things—bounce back away from the support or resistance level, or violate the price level and continue in its direction—until it hits the next support or resistance level.
The timing of some trades is based on the belief that support and resistance zones will not be broken. Whether the price is halted by the support or resistance level, or it breaks through, traders can "bet" on the direction and can quickly determine if they are correct. If the price moves in the wrong direction, the position can be closed at a small loss. If the price moves in the right direction, however, the move may be substantial.


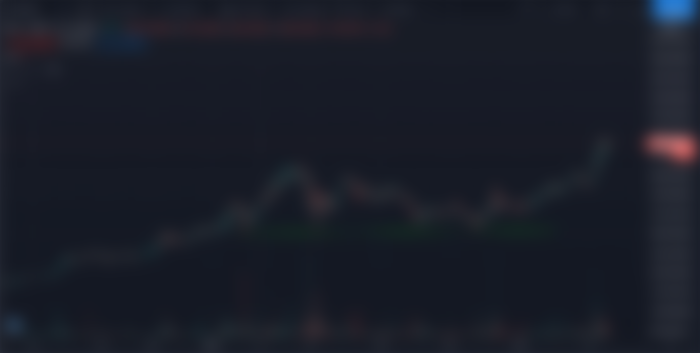
As we can spot in the chart, the price of 1775 served as resistance for ETH in the past few days. Resistance levels are also regarded as a ceiling because these price levels represent areas where a rally runs out of gas. However, sometimes the price breaks through to new heights as ETH did in our case.

Support levels are on the other side of the coin. Support refers to prices on a chart that tend to act as a floor by preventing the price of an asset from being pushed downward. As you can see from the BTC chart above, the ability to identify a level of support can also coincide with a buying opportunity because this is generally the area where market participants see value and start to push prices higher again.
Trendlines
The examples above show a constant level that prevents a crypto asset's price from moving higher or lower. This static barrier is one of the most popular forms of support/resistance, but the price of crypto assets generally trends upward or downward, so it is not uncommon to see these price barriers change over time. This is why the concepts of trending and trendlines are important when learning about support and resistance.
When the market is trending to the upside, resistance levels are formed as the price action slows and starts to move back toward the trendline. This occurs as a result of profit-taking or near-term uncertainty for a particular issue. The resulting price action undergoes a "plateau" effect, or a slight drop-off in cryptocurrency price, creating a short-term top.
Many traders will pay close attention to the price of a cryptocurrency as it falls toward the broader support of the trendline because, historically, this has been an area that has prevented the price from moving substantially lower. For example, as you can see from The Graph (GRT) chart below, a trendline can provide support for an asset for quite some.

On the other hand, when the market is trending to the downside, traders will watch for a series of declining peaks and will attempt to connect these peaks together with a trendline. When the price approaches the trendline, most traders will watch for the crypto asset to encounter selling pressure and may consider entering a short position because this is an area that has pushed the price downward in the past.
Unlike the rational economic actors portrayed by financial models, real human traders and investors are emotional, make cognitive errors, and fall back on heuristics or shortcuts. If people were rational, support and resistance levels wouldn't work in practice.
That's it for this article! I hope you learned something new about technical analysis.
Until next time!