I mentioned in my last article that I will come back with some candlesticks patterns and technical indicators to spot powerful trends. However, I realized that there are some essentials that still have to be covered. I want this guide to be comprehensive in order to be useful also for those with little to no experience in technical analysis.
For those who missed part 1, the article is available here. The two most important things I explained there are:
- how to use the right time frames in order to distinguish between a flash pump n dump and a powerful trend (this is crucial for any technical analysis framework);
- what is a candlestick, how is formed, and some Doji candlestick patterns (a name for a session in which the candlestick for a crypto asset has an open and close that are virtually equal and are often components in patterns. Doji candlesticks look like a cross, inverted cross, or plus sign).
Before moving one, I suggest you open Trading View. You will only get better by practicing so you have to get familiar with this tool. I think TradingView is the best free tool available there for trades. It is easy to use and it has all the features a trader needs.
Types of Graphs & Charts
On Trading View you have various options for charts & graphs. From the top left side of your Trading View, you can select which type of chart do you want to use. You can choose between Bars, Candles, Hollow Candles, Line, Area, Baseline.
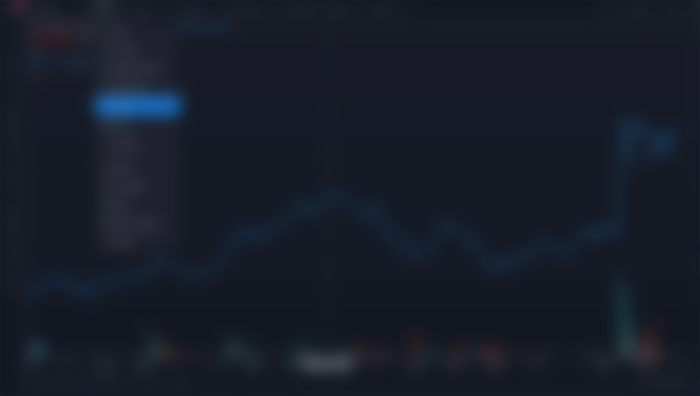
All types of charts are ok if you know what kind of technical indicators to use on that specific chart in order to help you spot trends and price movements. I will build on this idea in future articles when I will show you some combinations of charts and technical indicators together with the strategy I use with them. For the moment I recommend you select the Hollow Candles and keep this type as a standard.
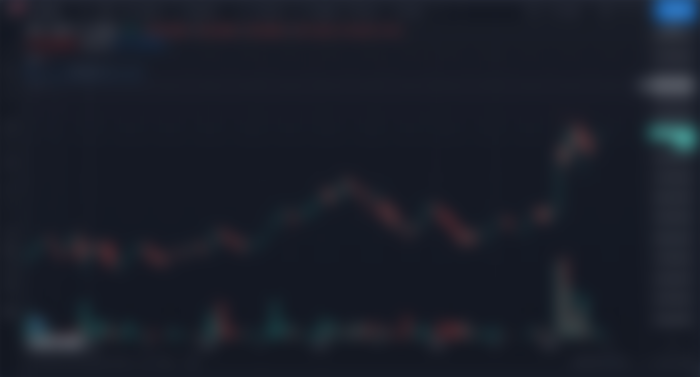
As you can see from the chart above, the Hollow Candles are fancier and this is because they provide more information than a regular line chart. Here you can see some candlesticks with different shapes and lengths in red or in green. On candlesticks provides information about what happened in that trading session. To make it simple:
1 candlestick = 1 trading session = 1 selected timeframe (In the above chart the time frame is 1 hour)
So in this particular case, 1 candlestick will tell what happened in that particular hour. We saw last time some Dojo candlesticks patterns which are a particular type of candlesticks. Now I realize that I should have started with the following explanation.
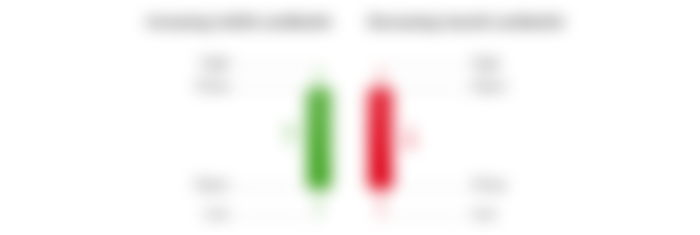
A candlestick shows the market's open, high, low, and closing for that trading session. The candlestick has a wide part, which is called the "real body." This real body represents the price range between the open and close of that day's trading. When the real body is filled in or red, it means the close was lower than the open. If the real body is empty (for Hollow Candles)or filled in green, it means the close was higher than the open.

Some Key facts about candlesticks:
Candlestick charts are used by traders to determine possible price movements based on past patterns.
Candlesticks are useful when trading as they show four price points (open, close, high, and low) throughout the period of time the trader specifies.
Many algorithms are based on the same price information shown in candlestick charts.
Trading is often dictated by emotion, which can be read in candlestick charts.
I will close part 2 of this guide here and leave you to explore all the types of charts in Trading View. In part 3 we are going to learn about the role of support and resistance in technical analysis.
See you next time! :)