In this bull run you need a deep understanding of the market in order to put your hands on those juicy profits. Technical analysis is a starting point that can help you make good trades on different crypto assets. However, cryptocurrencies are heavily correlated with BTC and general perceptions regarding the market trends. You need to have a clear overview and also introduce into the equation the market sentiment before you make any moves on exchanges.
Here are 3 indicators that will help you have a good understanding of the market dynamics and help you adjust your training strategies in order to get the most of this bull run:
1. Bitcoin Dominance Index (BTC.I)
The Bitcoin Dominance Index is a metric that traders can use to quickly get a sense of Bitcoin's value relative to that of the broader digital currency market. It measures Bitcoin's market capitalization (market cap) compared to the overall market for these digital assets.
For example, if the total market cap of all cryptocurrencies is $100 billion and the BTC.I is 62, this means that 62% of the market cap of all crypto assets is represented by bitcoin.
Analysis:
When the Bitcoin Dominance Index decreases, it means that people are more interested in investing in altcoins and we can expect market movements on alts. These generally happen when BTC is in consolidation phases and people are getting bored so they start trading more alts. This would be a great moment to get into short time trades, take the profit and invest it in bitcoin. If you have a reasonable benchmark, let's say 10%, you will know when to sell the alts. If you don't hodl them for the long term, don't wait for the price to increase more - respect your rules and your benchmark.
When BTC.I increase, this means that people are having bullish expectations on bitcoin so they buy more of it. This cycle comes after consolidation periods and it is a great moment to sell your BTC when the market is high and invest in some alts until the cycle resets.
You can apply the same strategies by also taking into consideration the Ethereum Dominance Index (ETH.I). Also introducing ETH in the equation can give you a powerful understanding of where the money is flowing in the market.
2. Crypto Fear and Greed Index
Keeping your cool in moments of high market volatility can be a game-changer. Most people don't do it and they end up getting in all sorts of bad trades and losing money. People are highly emotional in the crypto space and most of them buy and sell on impulse.
As a rule of thumb, people tend to get greedy when the market is rising which results in FOMO (Fear of missing out). Also, people often sell their coins in irrational reaction of seeing red numbers.
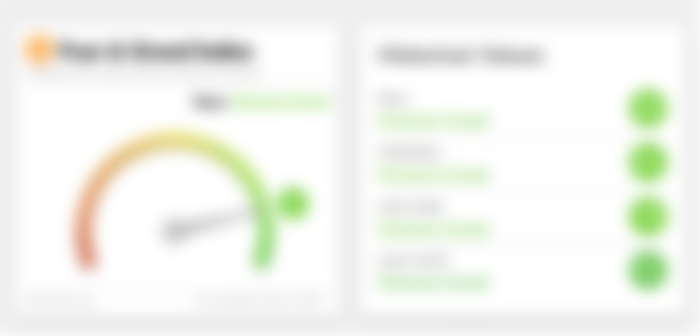
Crypto Fear and Greed Index analyze the current sentiment of the Bitcoin market and crunch the numbers into a simple meter from 0 to 100. Zero means "Extreme Fear", while 100 means "Extreme Greed".
Analysis:
Extreme fear can be a sign that investors are too worried. That could be a buying opportunity.
When Investors are getting too greedy, that means the market is due for a correction.

This index is compiled from Bitcoin-related news published on the news aggregator Hodl Hodl News.
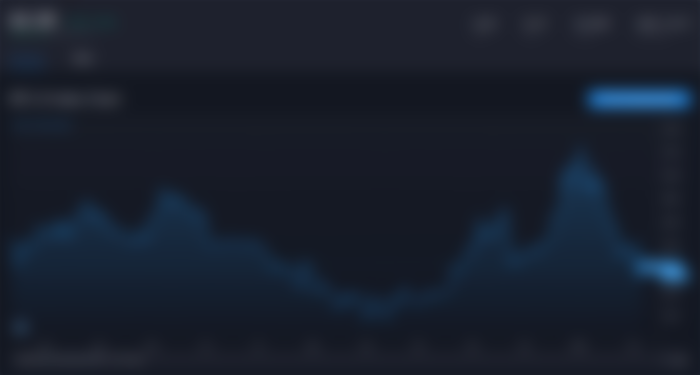
Here you have two options for the chart section: you can check the bitcoin-related news separately into three charts (bullish, bearish, neutral), or you can use the cumulative chart section which combines bullish and bearish charts into one trend.


Analysis:
As you can see from the chart, the number of bullish news increased in the last month meaning that people are getting really excited about BTC and have bullish expectations.
If a line is close to zero it means that that type of news had little to no impact in that time frame. In our case, the bearish news were close to the zero benchmarks.
You might think that neutral news have no impact on the market. However, when the volume of neutral news is increasing, it means that more and more people are interested in the crypto space. In our chart, the content created increased exponentially in the last month which generally has a positive impact on the market.
I hope you find this article useful. Let me know what do you think about these indicators in the comment section.
Good luck with your trading!