Pyramids, Bubbles and Logarithms

(The Archive: Article) As I write this, late September 2021, we have bubbles inflating all around us. At the same time we live in pyramid structures. But the best way to understand the geometry and inner workings of the world surrounding us is often by means of logic and arithmetic; *Logos* + *arithmós* from their Greek roots. To understand more deeply the world that surrounds you, those three shapes should be in your **mind's toolbox**. In fact, logarithms are so natural that even without *e*, Euleur's number or the "Natural Constant", we still perceive our world **mostly** in logarithmic scales. If you want a refresher on those notions or wish to see how they shape your reality as well as mine, read on. Bubbles As I am writing this, the bubble in cryptocurrencies is deflating. But not for long. As I write this, I expect to see Bitcoin bottom at 37.5K USD on October 5th. From there, I think, it will be up until the end of the year. So my analysis, which could be wrong, tells me that by year end, the cryptocurrencies market will be in a **fully blown bubble**, similar to that which marked the end of 2017. This times however, we are going to experience a bubble in both cryptocurrencies and in the stock market of the biggest economies in the world (USA, Japan, China and Europe at large.) In parallel, but not unrelated, we have the 30 year+ long bubble in bonds and sovereign debt instruments. See my article regarding Interest rates to understand why a constant bid on bonds, i.e. constant demand, drives their prices up and their interest rates down. https://read.cash/@Librarian/interest-rates-vary-inversely-with-b7012ace Also, we have bubbles inflating in the real estate markets. The current collapse of Evergrande in China is one such example of a bubble forming and its subsequent collapse. Collapsing bubbles are the mechanisms that allow a market to "get back to normal". It lets things fall back down to earth and it **purges the system of bad debt**. Who pays the bill in the end is a different story every time.

When a bubble forms, it can grow to proportions that you had not anticipated. When those bubbles pop, they do so in a spectacular fashion, liberating much stored energy, in the same way as a volcano has built up pressure underground and finally lets that pressure loose in our atmosphere. I use this opportunity to extend my warmest encouragements for the people of the Canary islands currently facing a volcanic eruption. **Here is the takeaway**: We will see bubbles inflating even further **as we near year end**, especially in the crypto markets. This is not something to be afraid of but you should be aware. The bubble will inflate and many emotions will be visited: optimism, belief, enthusiasm and euphoria. People's greed will take enlarged proportions and that will result in increased positions. More leverage will be added and Metcalfe's law will play itself out by revealing a cyclical network effect which makes everybody want to buy Bitcoin. We also call this *"FOMO": Fear Of Missing Out.* There is also a bubble in the stock market but that one is much more **managed**. We can see the insane correlation that has built up in between Fed Balance Sheet expansion and the S&P 500:
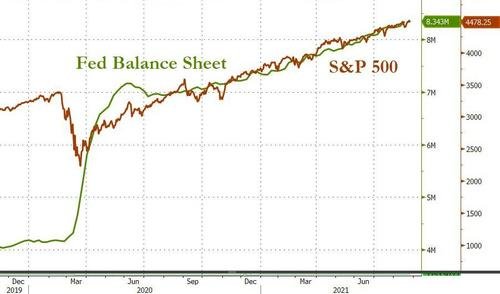
When I say the word managed, I mean that the S&P 500 is supported by all this money printing. You could also easily pull up the chart of the Venezuelan stock market as the country was debasing its currency: It follows and **exponential curve** upwards. Take a look at the following comparison:
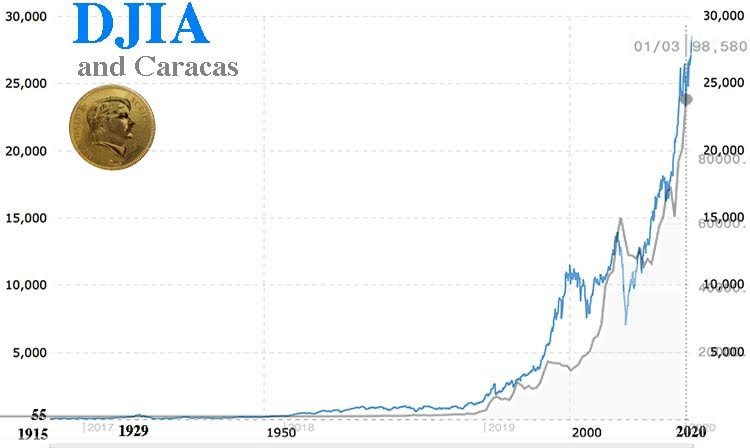
*(Above: The Dow Jones Industrial Average and the Caracas, Venezuela, stock exchange. Source:* *https://goldbroker.com/news/the-caracas-syndrome-1726**)* The US and its allies benefit from access to the World Reserve currency, the *King Dollar*. As such, Euro, Dollar, Yen, Pound, AUD, CAD, etc. are tied together in complex derivatives structures explained below (see pyramids). They can all devalue at the same time and with the help of the IMF, the BIS and the World Bank, they can pretty much print at will to sustain the slow constant growth of their stock markets. Recessions are thus quickly prevented but the **system is structurally weaker**. Recessions should be allowed to happen, to clear out bad debts and to redistribute wealth and production more efficiently. The systems grows weaker as it promotes zombie corporations unable to stay profitable without help and zombie governments unable to stay out of deficits given their ever increasing debt burdens. This is the problem of the Eurozone at large. By law, central banks should not be able to fuel those constant deficits. They circumvent the law by creating "vehicles" and using those to exchange bonds and money with governments. Or they use third party fellow bankers who qualify as primary dealers.
Back to crypto, at year end, when the bubble will deflate, we shall experience what is often called "*crypto winter*". This is not financial advice, do your own research but I plan on selling near the top. Four years later, starting in 2024 and peaking in 2025, we will have a similar cycle with another bubble forming and bursting. To get rich, you sell at the top and buy back at the bottom. To sell at the top you need a buyer willing to pay that much. This is where retail buyers and emotions come into play. The obvious culprit for the conditions that exist today in the stock markets are the **central banks around the world, which are facilitating and enabling government spending to go unchecked**. Populations are oblivious to this because it is a hidden tax. They just see prices going up and call that inflation. In fact, inflation applies to the money supply, not to prices. A consequence of inflating the money supply, if there is some money velocity, is that prices tend to rise. My follow-up article will talk about those bubbles and examine how they will pop. I expect the following bubble to form up for the cryptocurrencies market before year end:

As you can see in the picture above, my bubbles don't look like bubbles at all. They look like exponential curves. More on that below in the logarithm section. But for now, let's talk about pyramids! Pyramids I mentioned in the introduction that we live in pyramid structures. The pyramids I am referring to, of course, are not the ones built of stone and crowned by a shining pinnacle that reflects light across the lands. It is the inverted pyramid of Exeter and the standard bottom-heavy pyramid of wealth, where the top is crowned by jewels, diamonds and other necessities of the rich.
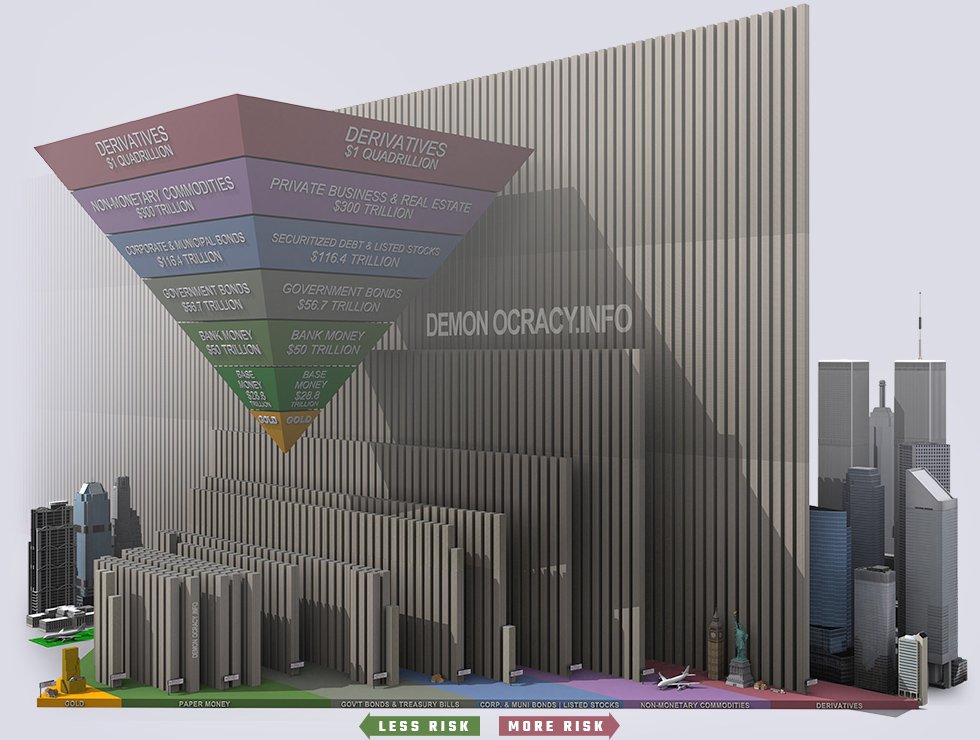
I have already written about pyramids, if only by using an illustration, in my article about *Seeking Truth*. That pyramid is called Exeter's pyramid and it takes its name from the man who invented the concept: John Exeter (1910-2006). https://read.cash/@Librarian/seeking-truth-c5c4532b At the bottom, you have the commodities, real tangible assets, such as gold. Those assets, in a structured financial system that wishes to allow fractional reserve banking for certain actors, can be sold in paper form or more recently, in entirely electronic form. The **entire pyramid is built by leveraging the collateral** that forms the base and building new vehicles and instruments and options and contracts and swaps and other ingeniously named financial products on top of it. The pyramid of wealth has grown much taller since the pandemic began. Those at the top are feeling the vertigo effect and some apparently love it so much that they even seek to experience that very same feeling from space, where they can marvel at the wonders that they have built. They are our *modern Dragons*. https://read.cash/@Librarian/encyclopaedia-draconnica-6482cd20#real-dragons So just to get all wet regarding symbolism, have you ever seen an Eye within or on top of a Pyramid, within a Bubble or circle? Yeah, it is printed on the most counterfeited paper money in the world currently:

*(Above: Zoom on the US Dollar. Copyright: The Federal Reserve. All rights reserved. Do not print as it is called counterfeiting and is prohibited by law!)* Who or which group sits at the top of the pyramid with an all seeing eye? Who controls money worldwide? What does "*Novus Ordo Seclorum*" mean? It is a rhetorical question. I have already searched the answer. I will let you do some research and tell me in the comments. Logarithms The final part of my article touches on this wonderful mathematical concept. I will briefly explain the concepts of logarithms here but not as a mathematics teacher would. Instead, what I wanted was to impart the notion that **exponential behaviours**, whichever they are in nature, are often easier to illustrate for us by using a **logarithmic scale**. Doing that, takes the exponential factor out and allows us to witness changes on a linear scale, which we are most used to. A logarithm is equivalent to an exponent. A *log* or *ln* function gives you the exponent that matches its parameters, usually a variable *x*. An easy way to remember what is a logarithmic scale is by keeping in mind that a regular scale uses additions between each number. Typically, the step is +1 between each unit, on a linear scale. **A logarithmic scale uses multiplications between each number**. So the difference is in the type of mathematical operation we apply as we draw the scale itself. Linear scale (additions between each):1, 2, 3, 4, 5, ... Log scale (multiplications between each (x2)): 1, 2, 4, 8, 16, ... Log scale (multiplications between each (x10)): 1, 10, 100, 1000, 10000,... Our perceptions of the world are logarithmic. This is because light and sound both decrease in intensity with the square of the distance. Or, said otherwise, they increase exponentially (with an exponent of 2) as they get closer to you. It is also the same for gravity. Take sound for example: Because a sound source will emit air pressure waves in all directions, the intensity of those waves decreases with the square of the distance. This is why we use dB (decibels) to measure sound amplitude intensity. It is a logarithmic scale. Here are a few examples to illustrate: 0 dB: Barely perceptible, known as the hearing threshold 60 dB: A normal conversation at 1m distance 120 dB: Threshold of pain So what those values show is that from 0 to 60 dB is not that big of an increase. Hearing nothing vs. a normal conversation seems like a somewhat small increase in loudness. But notice that if you again add another 60 dB, then you are already at the threshold of pain for the human ear. So the increase that we perceive, from 0 dB to 60 dB is much smaller than the increase that we perceive, from 60 dB to 120 dB. As a consequence, if someone were to ask your permission to increase the volume by 10 dB, you should first inquire at the current level. Because going from 0 dB to 10 dB will make almost no difference but going from 120 dB to 130 dB might cause serious harm to anyone in the surrounding. Finally, to conclude this section on Decibels, remember that each added dB represents a multiplication of the intensity of the sound by a factor of 1.26. This is why we call it a logarithmic scale.

Bitcoin (BTC) on a linear scale goes off the chart. Check my article: *Crypto vs. Gold: How to Argue* for more on that. https://read.cash/@Librarian/crypto-vs-gold-how-to-argue-77db3980 **BTC on a logarithmic scale is just beautiful**. A mathematically finite scarcity which allows additional supply to enter the market at a rate that lowers by a factor of two every four years. Euleur's dream of an exponentially limited currency backed by distributed trust and proof of work networks come to fruition!

What can be noticed immediately, is that unlike many other stocks or commodities since the dawn of time, Bitcoin and other cryptocurrencies are the only ones to **exhibit an exponential behaviour**. And this becomes apparent immediately in the picture above because Bitcoin, since its start, has followed precisely an exponential function. Here is the natural logarithm function (*ln*) superimposed, roughly, with the BTC chart shown above:
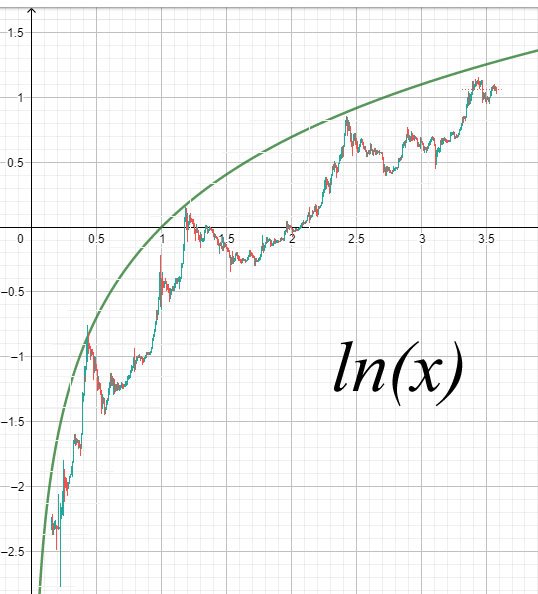
As you can see, for this cycle, **we have yet to peak into bubble territory** (touch the green line). See my explanation above in the bubbles section. The BTC rainbow chart is also excellent, with a logarithmic scale, at describing the cycles of this living Metcalfe's Law example that is BTC:
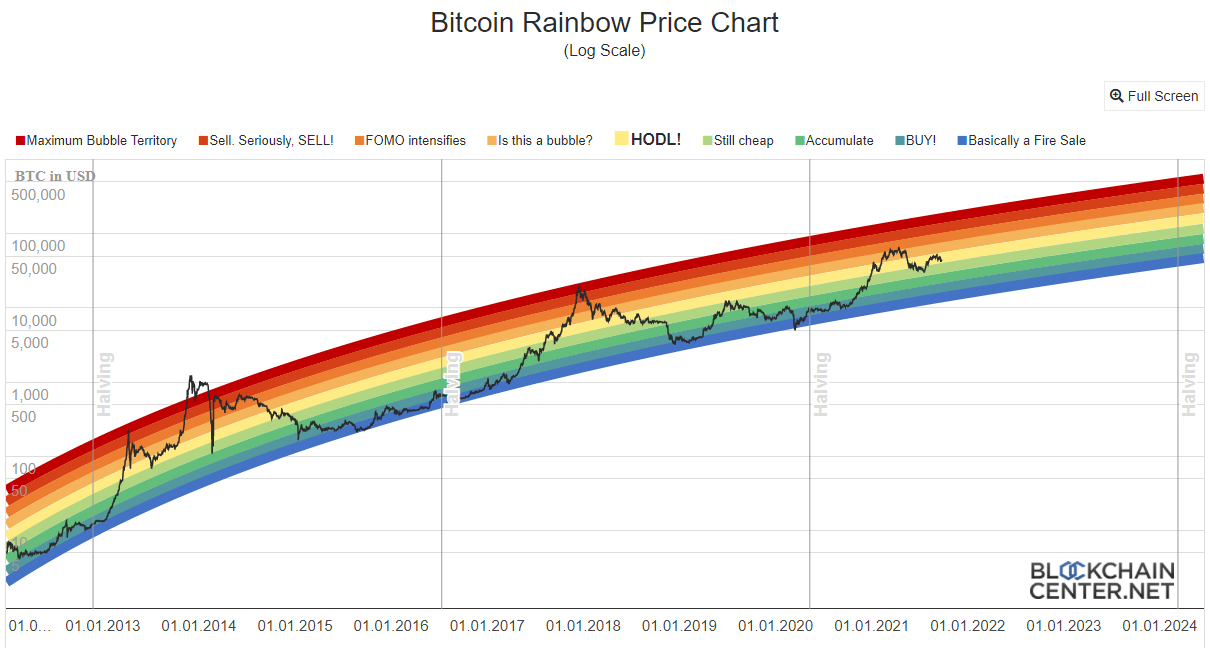
*(Above: BTC rainbow chart shown with a log scale and with colour bands representing overvalued and undervalued regions. Src below.)* Again, as stated many times above, I think that we have yet to visit those red colours for this cycle and that means that the current small correction in late September 2021 will be short lived. This is pretty much a repeat of what happened in 2013, as seen in the above graph. Coming Up Next Up next is a quick article which examines the **Canadian electoral system's problems**. Right after that however is the follow-up to this article, with an examination of what will happen when Double Bubbles Pop! Follow my channel today so you don't miss out. https://read.cash/@Librarian/canadas-broken-electoral-system-600m-later-c0562715 Thanks for reading! Resources: https://blockchaincenter.net https://demonocracy.info/infographics/world/lqp/liquidity_pyramid.html https://goldswitzerland.com/time-to-say-goodbye-to-the-everything-bubble/
No comments yet